



By: Ralf Ellspermann
25-Year, Multi-Awarded BPO Veteran
Published: 24 September 2026

Reviewed By: John Maczynski
Former EVP, World's Largest Contact Center
Updated: 24 September 2026
Roughly $14 to $28 per fully loaded hour, depending on the qualification the work requires. The figure is only comparable between providers once the denominator is agreed: a rate quoted per productive hour and a rate quoted per paid seat hour are different numbers describing the same money.
Key Takeaways
- Rates run about $14 to $28 an hour across three qualification tiers, against roughly $7 to $12 for general Philippine back-office work. The premium buys a professional qualification, not a faster labeller.
- The denominator decides the comparison. The same $31,200 seat-year can be quoted as $20.00, $17.00 or $15.00 an hour depending on the assumed utilisation and whether productive or paid hours are the divisor.
- A lower headline rate can be the more expensive contract. A quote at $17 per paid seat hour costs 13% more annually than one at $20 per productive hour at 75% utilisation.
- The rate saving and the programme saving are different numbers. A $21 Philippine hour against $120 onshore is an 82% rate gap. The 50% to 65% programme saving quoted in this category is the honest figure, and the difference is retained cost.
- Tier allocation moves the blended rate more than negotiation does. Running everything at the senior tier costs $25.50 an hour blended. A disciplined 60/30/10 split costs $18.30 — 28% lower, before a single rate is negotiated.
- Managed-outcome pricing buys risk transfer, not a lower rate. The management margin is the price of holding the provider to agreement and throughput thresholds rather than absorbing variance internally.
What Do Specialized LLM and RLHF Roles Cost Across Each Tier?
Approximately $14 to $18 an hour for general data curation, $18 to $23 for domain-specific RLHF ranking by certified professionals, and $23 to $28 for advanced technical tuning by senior engineers and legal associates. General back-office work in the same market runs $7 to $12.
Philippine providers structure billing around cognitive complexity rather than task volume, because the work is not interchangeable. Supervised fine-tuning and reinforcement learning from human feedback both require an evaluator who can judge factual accuracy, reasoning quality and safety constraints — none of which reduce to a labelling rule that a lower-cost worker can be trained into over a weekend. The hubs in Manila, Cebu and Davao segment talent accordingly.
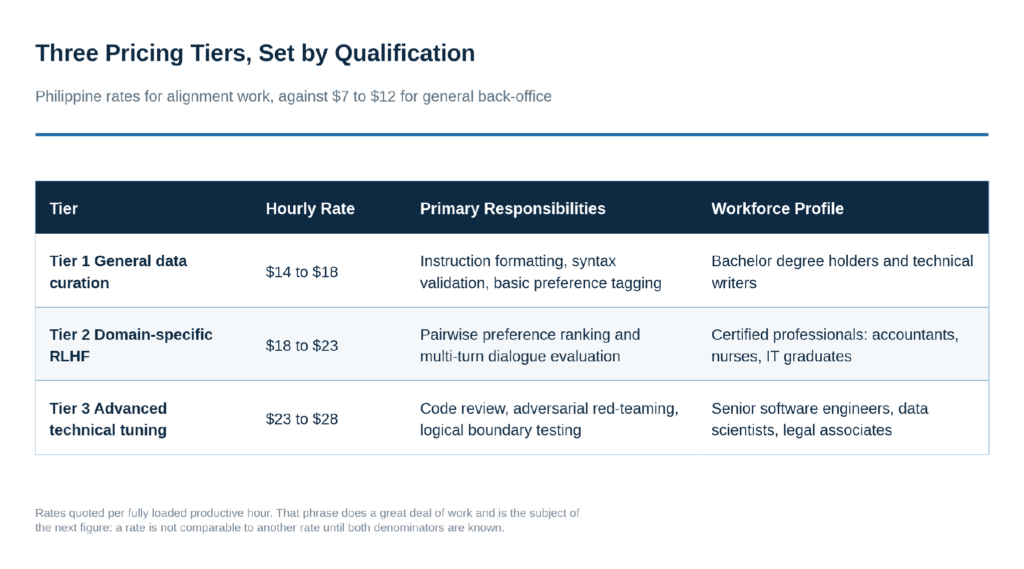
Figure 1. Three pricing tiers, set by the qualification the work demands.
The spread from bottom to top is a factor of two, and it is the qualification that explains it. When a certified public accountant ranks tax reasoning, or a senior engineer red-teams generated code, the engagement is buying professional time. The arbitrage against an equivalent Western professional is proportionally wider than the arbitrage on general annotation — which is why the specialist tiers are often the better commercial case, not the worse one.
What the table does not settle is whether two quotes inside the same band are actually comparable. That question is a matter of arithmetic rather than judgement, and it is where most of the avoidable cost in this category sits.
Why Can Two Quotes at Different Rates Cost the Same Amount?
Because a fully loaded hourly rate is a quotient, and providers do not all use the same divisor. The same annual seat cost can be presented as a rate per productive hour at an assumed utilisation, or as a rate per paid seat hour, and the two differ by twenty per cent or more.
Consider a pod seat that costs $31,200 a year. Against a standard 2,080-hour paid year, that is $15.00 per paid seat hour. If the provider quotes per productive hour and assumes 85% utilisation — netting out breaks, training, calibration sessions, system downtime and absence — the same seat is $17.00. At a more conservative 75% assumption, it is $20.00. Nothing about the commitment has changed. Only the denominator has.
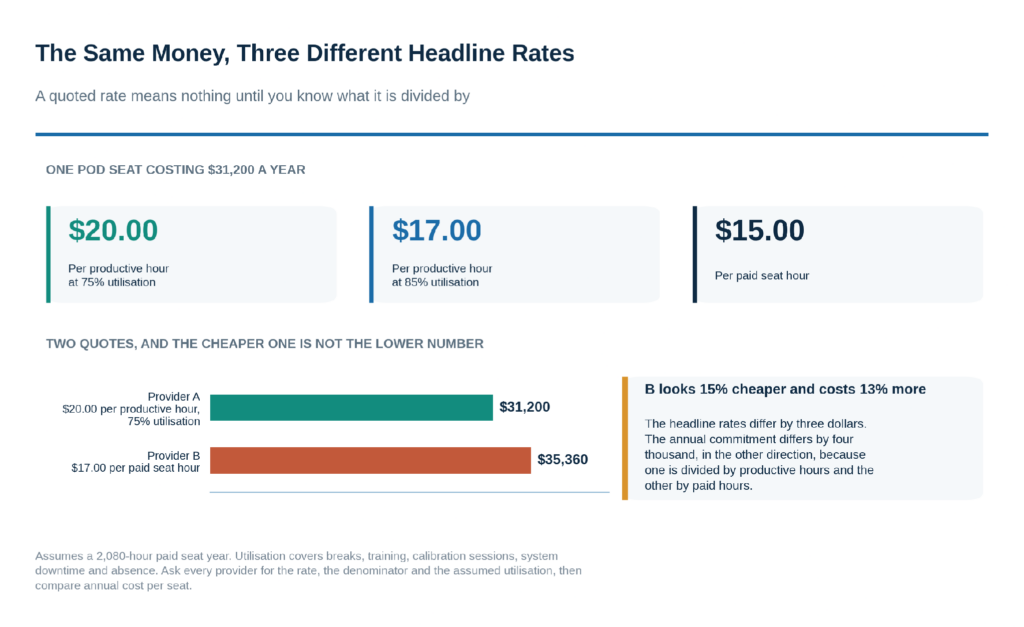
Figure 2. One annual cost, three defensible headline rates, and a comparison that inverts.
The consequence for procurement is the inversion shown in the lower half of Figure 2. Provider A quotes $20.00 per productive hour at 75% utilisation and will cost $31,200 a year per seat. Provider B quotes $17.00 per paid seat hour and will cost $35,360. Provider B’s headline is 15% lower and its annual commitment is 13% higher. A shortlist ranked on quoted rates would have chosen the more expensive option and recorded it as a saving.
This is not usually a deception. It reflects genuine differences in how providers cost their operations, and a provider quoting per productive hour at a conservative utilisation is arguably being the more transparent of the two. But it makes the headline rate an unreliable sort key.
What to ask before comparing any two rates
Three questions settle it. First: is the rate per paid seat hour or per productive hour? Second: if per productive hour, what utilisation assumption sits behind it, and is that assumption contractual or indicative? Third: what is the resulting annual cost per seat at the committed volume? The third question is the only one whose answer is directly comparable across proposals, and it is the number that belongs in the evaluation matrix.
Why Is the Programme Saving Smaller Than the Rate Gap Suggests?
Because the rate gap measures only the provider’s invoice. A $21 Philippine hour against a $120 onshore hour is an 82% reduction on rate alone, while the 50% to 65% programme savings quoted in this category are net of retained cost — oversight, transition, tooling and client engineering time that never leaves the buyer.
Both figures circulate in this market and they are frequently placed side by side as though one were a more optimistic version of the other. They are measuring different things, and the gap between them is the useful part.
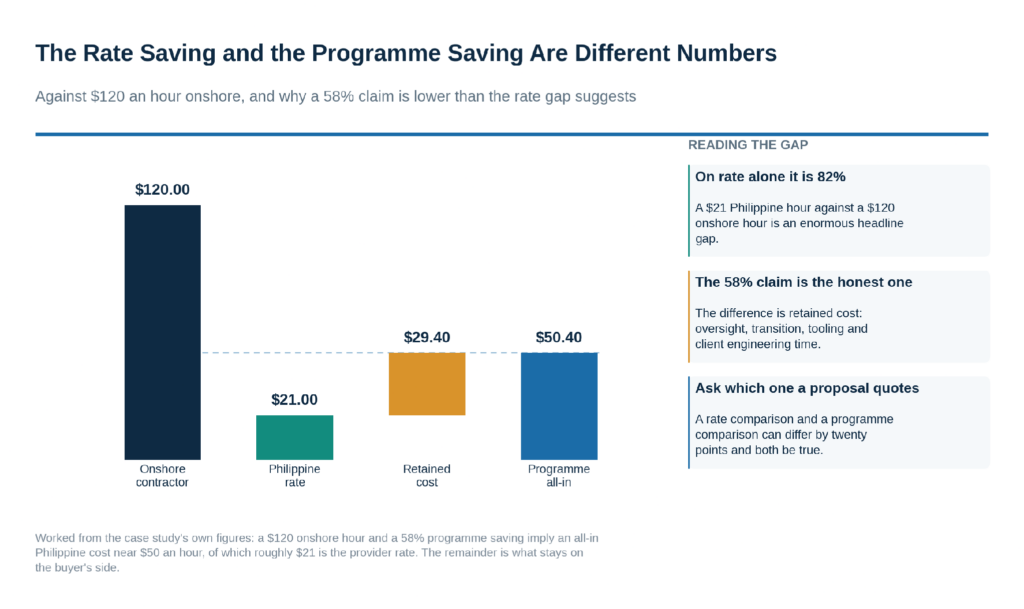
Figure 3. Working the case study’s own numbers back to what the buyer actually retains.
The arithmetic runs in one direction only. If onshore preparation cost $120 an hour and the programme saving was 58%, the all-in Philippine cost was near $50.40 an hour. If the provider’s rate inside that programme was around $21 — squarely within the Tier 2 band — then roughly $29.40 an hour stayed on the buyer’s side of the line. That residue is not waste. It is machine learning engineering time spent writing and revising rubrics, the transition period before the pod reaches steady state, tooling and licensing, and the internal management attention any offshore programme consumes.
For a business case, this distinction decides whether the model holds. A case built on the rate gap will forecast a saving the programme cannot deliver, and the variance will surface in the first quarterly review as an overrun that nobody budgeted. A case built on the programme figure will be defensible, and will also make visible the one cost line a buyer can genuinely compress: its own engineering time, which falls as the rubrics stabilise.
What Sits Inside a Fully Loaded Rate?
Specialist wages are roughly 55% of a managed Philippine alignment rate. The remainder covers multi-tier quality supervision, secure facility and connectivity, locked-down desktop and tooling licences, and continuous calibration — the components that separate a research-grade dataset from a cheap one.
The phrase fully loaded is doing a great deal of work in every quote in this category, and buyers rarely ask what it contains. The composition below is indicative rather than universal — it moves with security tier and domain — but it gives a basis for the question.
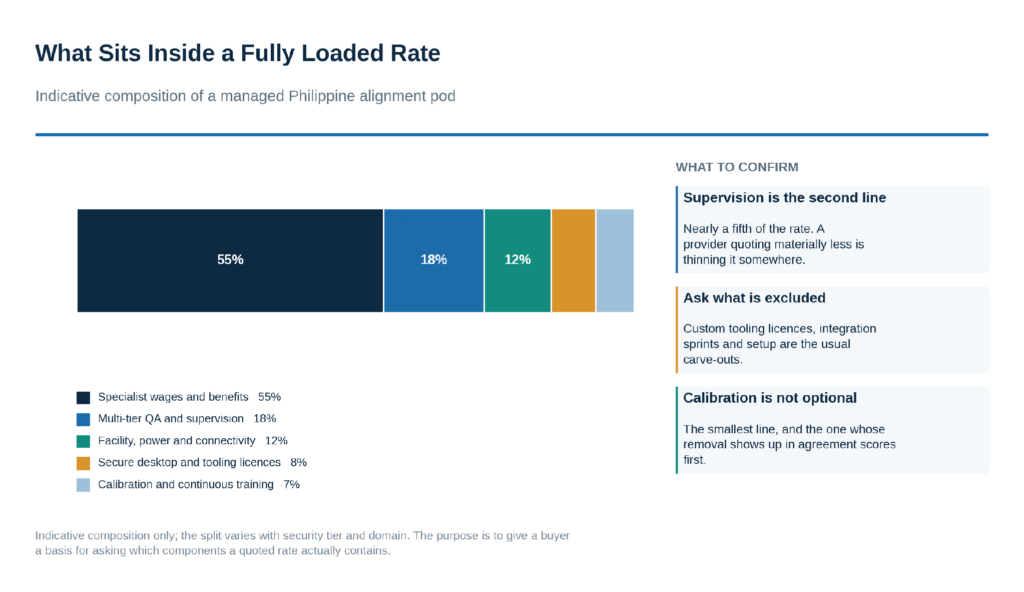
Figure 4. Indicative composition of a managed Philippine alignment rate.
Two lines deserve particular attention. Supervision at roughly 18% is the second largest component, and it is the one a provider competing on price will thin first. Multi-tier review, where primary output is audited by senior quality leads and validated against consensus metrics, is what produces consistency across a pod; remove it and the rate falls while the agreement statistics quietly degrade. Calibration at around 7% is the smallest line and the first to be cut, and its removal shows up as drift several weeks after the saving was booked.
Infrastructure is the component most often excluded rather than thinned. Secure virtual desktop environments, redundant connectivity and biometric facility access are usually inside a fully loaded rate at the top tier, but custom tooling licences, integration sprints and initial setup frequently are not. Those carve-outs belong in the commercial comparison, not in a change request three months in.
How Do Staff Augmentation and Managed-Outcome Pricing Differ?
Staff augmentation bills time and materials and leaves workflow management, calibration and throughput tracking with the buyer’s engineering team. Managed-outcome contracts carry a management margin and transfer accountability for inter-annotator agreement thresholds, error tolerances and delivery velocity to the provider.
The choice is usually framed as a cost decision and is more accurately a decision about where variance lands. Under staff augmentation the buyer holds it: if agreement drifts or throughput slips, the remedy is the buyer’s to design and the cost is the buyer’s to absorb. Under a managed-outcome agreement the provider holds it, and is contractually required to retrain underperforming personnel or absorb the cost of rework.
That protection is only as good as the metric it is written against. A managed-outcome contract specifying a kappa floor without also specifying how the sample is drawn can be satisfied by sampling comparisons that are easy to agree on. Agreement on preference data rises as the pairs get further apart, so the sampling protocol belongs in the contract alongside the threshold. Throughput targets without a defined quality gate have the same weakness in the opposite direction.
The practical test is the retained cost line from Figure 3. An organisation with machine learning engineers who have the bandwidth to manage an offshore pod directly will often find staff augmentation cheaper in total. An organisation whose engineers are the binding constraint — which is the more common case — is usually buying back its own capacity, and the management margin is the price of that.
How Can Procurement Teams Reduce Cost Without Weakening the Dataset?
By allocating work across tiers deliberately rather than defaulting to the senior tier, specifying calibration up front to avoid rework, pre-screening with automated validation before human review, and negotiating volume-based tier pricing. Allocation is the largest single lever and the one most often left unmanaged.
Most cost conversations in this category are about the rate. The larger number is usually the mix.
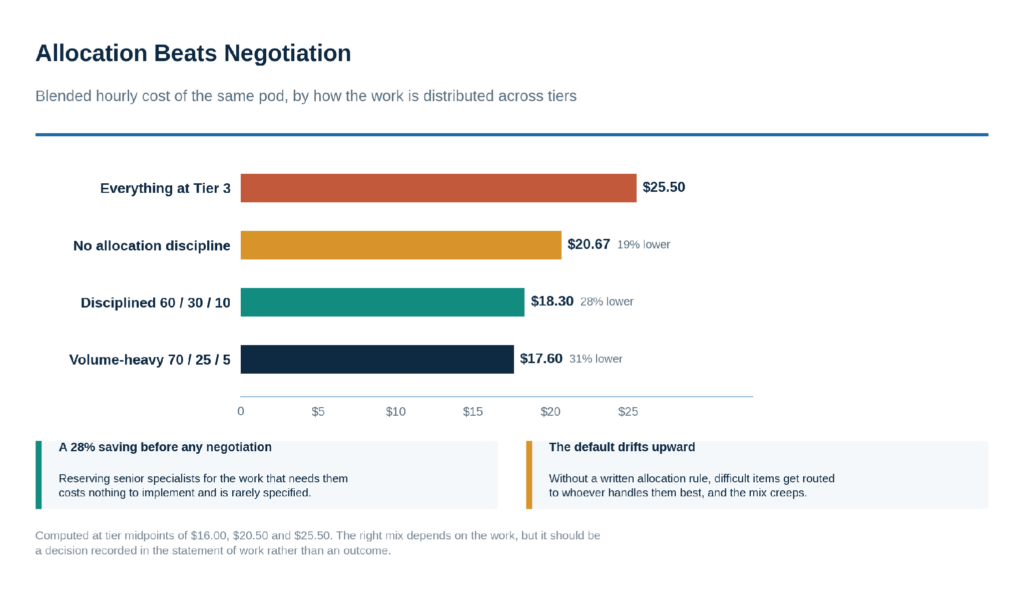
Figure 5. The same pod, priced by how the work is distributed across tiers.
Running every item through Tier 3 specialists gives a blended cost of $25.50 an hour at tier midpoints. Splitting the work 60/30/10 across the three tiers gives $18.30 — a 28% reduction achieved entirely through allocation, before any negotiation has taken place. No realistic rate negotiation against a competent provider produces a discount of that size, and yet allocation is rarely written into a statement of work at all.
The default drifts upward on its own. Without a written allocation rule, difficult items get routed to whoever handles them best, senior staff absorb work that a Tier 1 curator could complete, and the mix creeps toward the expensive end over the first quarter. The rule does not need to be complex: a documented routing policy, a defined escalation path, and a monthly report of actual hours by tier against the planned mix.
Where the remaining levers sit
Calibration discipline is second. A pilot with explicit rubric guidelines and boundary examples for edge cases eliminates redundant iterations; the cost of an ambiguous instruction is paid every time the batch it produced has to be reworked. Automated pre-screening is third — validation scripts that filter formatting and syntax errors before a human evaluator sees the item remove low-value work from the most expensive queue. Volume-based tier pricing is fourth, and is the only one of the four that requires the provider’s agreement.
What Do Industry Leaders Advise on Budgeting for AI Talent?
Treat annotation and alignment as professional judgement work rather than commodity back-office processing. Underpaying on labour quality damages dataset integrity, and the resulting training iterations cost more than the rate saving returned.
The framing error that drives most of the avoidable spend in this category is buying alignment work on the same basis as data entry, where the unit is an item processed and the cheapest compliant supplier wins.
The primary financial mistake enterprise buyers make in AI outsourcing is treating data annotation like commodity back-office data entry. When you are training frontier models, penny-pinching on labor quality destroys dataset integrity. The strategic advantage of the Philippines lies not merely in lower hourly rates, but in accessing top-tier cognitive talent that drives down training iteration cycles and accelerates enterprise deployment.
— John Maczynski, CEO, Cynergy BPO
- Evaluate on annual cost per seat, not on the quoted rate. It is the only figure that survives differences in denominator, utilisation assumption and inclusion scope.
- Write the tier allocation into the statement of work. It is worth more than the rate negotiation and costs nothing to specify.
- Model the retained cost explicitly in the business case. The gap between the rate saving and the programme saving is real, predictable, and the source of most first-year overruns.
How Did One Financial Services Firm Cost Its Alignment Programme?
A mid-sized financial technology firm was paying $120 an hour to onshore contractors to prepare 50,000 financial prompt-response pairs. A 25-person Manila team of certified public accountants completed the work at 58% lower programme cost, three weeks ahead of schedule, at 0.85 inter-annotator agreement.
The binding constraint was the quarterly research budget rather than capability. Onshore contracting was consuming it faster than the alignment work could progress, which is a common failure mode for tax and accounting models: the material genuinely requires a qualified accountant, and qualified accountants are expensive wherever they sit. The question was where to buy that qualification, not whether to.
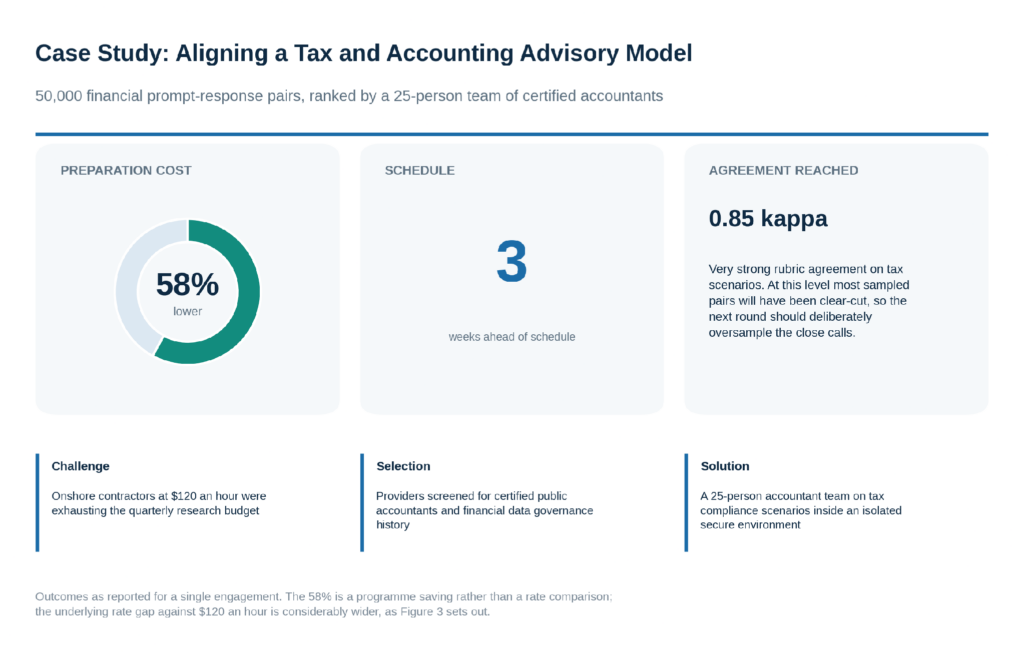
Figure 6. Reported outcomes from a 25-person certified-accountant pod in Manila.
Two features of the result are worth reading carefully. The 58% is a programme saving, not a rate comparison — as Figure 3 works through, the underlying rate gap was considerably wider, and the difference is what the client retained. And the 0.85 agreement score is strong evidence that the rubric was unambiguous and the accountants understood it, which for tax compliance scenarios is a real achievement. It also implies that most sampled pairs were clear-cut comparisons, so the natural follow-up for a second round is to oversample the close calls deliberately.
The three-week schedule gain came from parallelism rather than from cost. Twenty-five qualified accountants working concurrently is not a capacity an internal finance or data science function absorbs at the margin, and for a product with a fixed launch date that was the outcome that mattered.
Why Do Organizations Work with Cynergy BPO on AI Talent Sourcing?
Cynergy BPO is an independent, vendor-neutral outsourcing advisory firm headquartered in Manila, representing a vetted network of more than 100 Philippine providers. It maps requirements against performance data to produce a shortlist within days and manages competitive negotiation on the buyer’s behalf.
Who Is Cynergy BPO?
Cynergy BPO is an independent outsourcing advisory and consultancy firm headquartered in Manila, founded by industry veterans with more than 65 years of combined operational experience governing major global accounts. It specialises in connecting mid-market and enterprise organisations with vetted Philippine BPO providers across voice, back-office and AI data operations.
How Does Cynergy BPO Differ from Traditional Outsourcing Brokers?
Traditional brokers are transactional and are compensated by the providers they place, which shapes which provider is recommended. Cynergy BPO applies an advisory-led methodology, mapping exact technical and commercial requirements against performance data rather than against availability. In a category where quoted rates are not directly comparable, that difference determines whether a shortlist can be evaluated at all.
How Does Cynergy BPO’s Network of 100+ Vetted Philippine BPO Providers Benefit Organizations?
The network makes it possible to shortlist on the criteria that actually govern cost in this category: how a provider constructs its rate, whether it has staffed a legal, clinical, financial or engineering vertical before, and whether it can report agreement statistics rather than throughput alone. Approaching the market cold, a buyer cannot establish any of these before contracting.
How Does Cynergy BPO’s Advisory-Led Vendor Matching Process Work?
Requirements are mapped against operational and commercial criteria, a tailored shortlist of vetted providers is delivered within a few working days, and the firm then manages competitive proposal and negotiation processes on the buyer’s behalf. Rate construction, tier allocation and quality obligations are settled as part of that process rather than discovered afterwards.
Why Do Organizations Use Cynergy BPO?
Because the commercially important differences between providers in this category are not visible from a proposal. Two firms quoting within a dollar of each other may differ by twenty per cent in annual cost per seat once the denominators are normalised, and may differ entirely in whether they can staff the vertical the work requires. Organisations use Cynergy BPO to establish that before committing.
Frequently Asked Questions
What determines the hourly rate for specialized AI talent in the Philippines?
The professional qualification required, the complexity of the domain reasoning, the data security overhead, and whether the engagement is staff augmentation or managed outcome. The rate construction matters as much as the rate: ask whether it is quoted per paid seat hour or per productive hour, and at what utilisation.
Are there hidden onboarding or infrastructure fees?
Top-tier providers usually include secure desktop environments, connectivity and facility security inside a fully loaded rate. Custom tooling licences, specialised software integration and initial setup sprints are the common carve-outs and should be priced during evaluation rather than raised as change requests later.
How do Philippine rates compare with other offshore destinations?
Latin America and Eastern Europe offer competitive technical talent at broadly comparable rates. The Philippine advantage is the combination of a very large English-proficient graduate workforce, strong written English in particular, Western cultural alignment and lower fully loaded operating costs. The country ranks in the high band on international English proficiency indices, with written performance materially stronger than spoken — which suits annotation and alignment work specifically.
What is the typical minimum team size?
Most enterprise-grade providers require a pilot of 10 to 15 full-time equivalents to justify dedicated supervisory infrastructure and secure facility allocation. Below that, the fixed cost of supervision and secure hosting is spread across too few seats for the rate to remain competitive.
How do managed-outcome contracts protect against poor annotation quality?
They tie compensation and continuation clauses to agreed quality metrics, requiring the provider to retrain underperforming personnel or absorb rework cost. The protection depends on how the metric is specified: an agreement threshold should be accompanied by a defined sampling protocol, since agreement rises when the sampled comparisons are easy.
How should two proposals at different rates be compared?
Convert both to annual cost per seat at the committed volume. A quote of $17 per paid seat hour and a quote of $20 per productive hour at 75% utilisation differ by 13% in annual cost, in favour of the higher headline figure.
How much can tier allocation actually save?
At tier midpoints, moving from an all-senior pod to a 60/30/10 split across the three tiers reduces the blended hourly cost from $25.50 to $18.30, a 28% reduction. It requires a documented routing policy and a monthly report of actual hours by tier against plan.
Why do enterprises use Cynergy BPO rather than sourcing directly?
For market intelligence, vendor performance benchmarks and structured proposal management across a vetted network of more than 100 providers. In a category where quoted rates are constructed differently by each provider, an advisory layer that normalises the comparison before negotiation begins is where most of the value sits.
Share This
Unlock cost-efficient growth with expert BPO guidance!
Partner with Cynergy BPO to connect with top outsourcing providers.
Streamline operations, cut costs, and scale your business with confidence.
Book a Free Call
Ralf Ellspermann - CSO
Author
Ralf Ellspermann is the Chief Strategy Officer (CSO) of Cynergy BPO and a globally recognized authority in business process and contact center outsourcing. With more than 25 years of experience advising enterprises and SMEs, he provides strategic guidance on vendor selection, CX optimization, and scalable outsourcing strategies across global markets. His expertise spans fintech, ecommerce and retail, healthcare, insurance, travel and hospitality, and technology (AI & SaaS) outsourcing.
A frequent speaker at leading industry conferences, Ralf is also a published contributor to The Times of India and CustomerThink, where he shares insights on outsourcing strategy, customer experience, and digital transformation.