



By: Ralf Ellspermann
25-Year, Multi-Awarded BPO Veteran
Published: 28 September 2026

Reviewed By: John Maczynski
Former EVP, World's Largest Contact Center
Updated: 28 September 2026
With Cohen’s and Fleiss’ kappa, Krippendorff’s alpha, golden-set injection and outlier detection. All four are agreement statistics computed between annotators, never against truth, so each is blind to error the pod shares. That blind spot is what turns calibration into a trade rather than an improvement past a certain point.
Key Takeaways
- Every metric in the standard framework measures agreement, and none measures correctness. Kappa, alpha, drift detection and outlier flags are all computed between annotators or against a key the annotators were trained on. Error the pod shares moves all of them in the favourable direction.
- Calibration therefore has an optimum, and the metrics sit past it. Modelled on a pod trading independent error for shared convention error, accuracy peaks at 87.2% while kappa is still only 0.59. Kappa reaches the published 0.80 threshold at 83.5% accuracy — 3.7 points beyond the peak.
- Kappa measures the base rate as much as the reviewers. At fixed sensitivity of 92% and specificity of 96%, kappa runs 0.78 on a balanced task and 0.28 when the label applies to 2% of items. Raw agreement rises across that same range, from 88.8% to 92.2%.
- Which makes a flat 0.80 safety threshold the wrong way round. Safety violations are rare by construction, so the domain given the highest kappa target is the one where kappa is structurally lowest.
- Outlier detection flags the most accurate annotator when the pod shares a bias. In a simulated nine-person pod, the one annotator at 94.7% true accuracy shows 84.5% agreement with the majority, while the eight at 84.7% accuracy show 95.0%.
- “Agreement improved from 74% to 92%” is not a kappa and cannot be read as one. The same 92% is kappa 0.84 on a balanced task and 0.56 on a rare-event task. Percentages and kappa are different quantities and convert differently at every base rate.
What Statistics Do Providers Use to Measure Disagreement?
Cohen’s kappa for two raters, Fleiss’ kappa for a fixed number of raters who need not be the same people, Krippendorff’s alpha for mixed scale types and missing data, and golden-set accuracy for individuals. The selection is correct. The published thresholds need three adjustments.
Moving beyond raw percentage match is the right instinct, and it is the single most important methodological step a provider can take. Percentage agreement on a task where both reviewers say “safe” most of the time will look excellent while carrying almost no information, because most of that agreement would occur by chance. Chance-corrected coefficients exist precisely to strip that out.
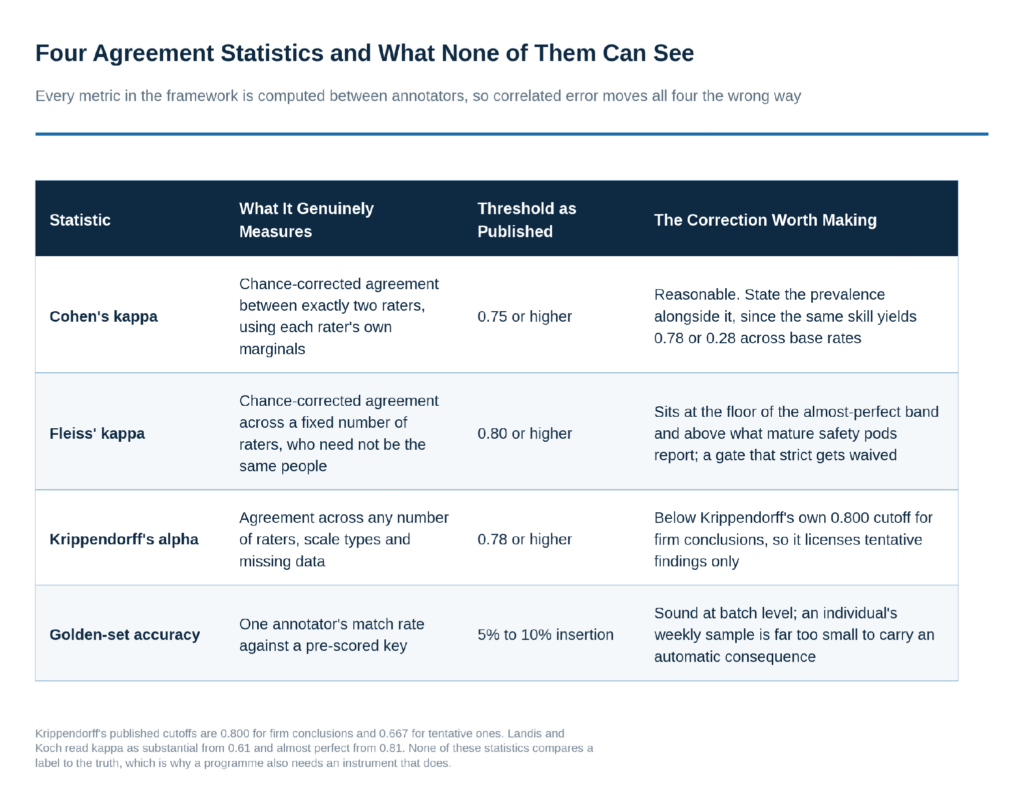
Figure 1. Four agreement statistics and what none of them can see.
The thresholds are where the framework needs work. Fleiss’ kappa at 0.80 sits at the floor of the band Landis and Koch call almost perfect, and above what mature safety pods in this category actually report after weeks of calibration. Krippendorff’s alpha at 0.78 runs the opposite risk: Krippendorff’s own published cutoffs are 0.800 for firm conclusions and 0.667 for tentative ones, so 0.78 licenses preliminary findings only — and it is applied to ordinal and text-span work, the most subjective content in the pipeline. One threshold is too strict to clear and the other is too loose to rely on, and they are set that way round.
The deeper issue is shared by all four. Each statistic compares labels to other labels, or to a key the same team wrote. None compares a label to the truth. That is not a defect in the statistics, which were designed to measure reliability rather than validity, and reliability is a real and necessary property. It becomes a defect when reliability is the only thing instrumented, because then a pod that is consistently wrong and a pod that is consistently right are indistinguishable to the entire quality system.
Why Does Identical Reviewer Skill Produce Kappa of 0.78 or 0.28?
Because kappa subtracts the agreement expected by chance, and chance agreement rises sharply as a label becomes rare. At fixed sensitivity of 92% and specificity of 96%, kappa falls from 0.78 at a 50% base rate to 0.28 at 2%, while raw agreement rises over the same range.
This is the most consequential and least discussed property of the metric, and it determines whether a threshold is a quality standard or an accident of the dataset.
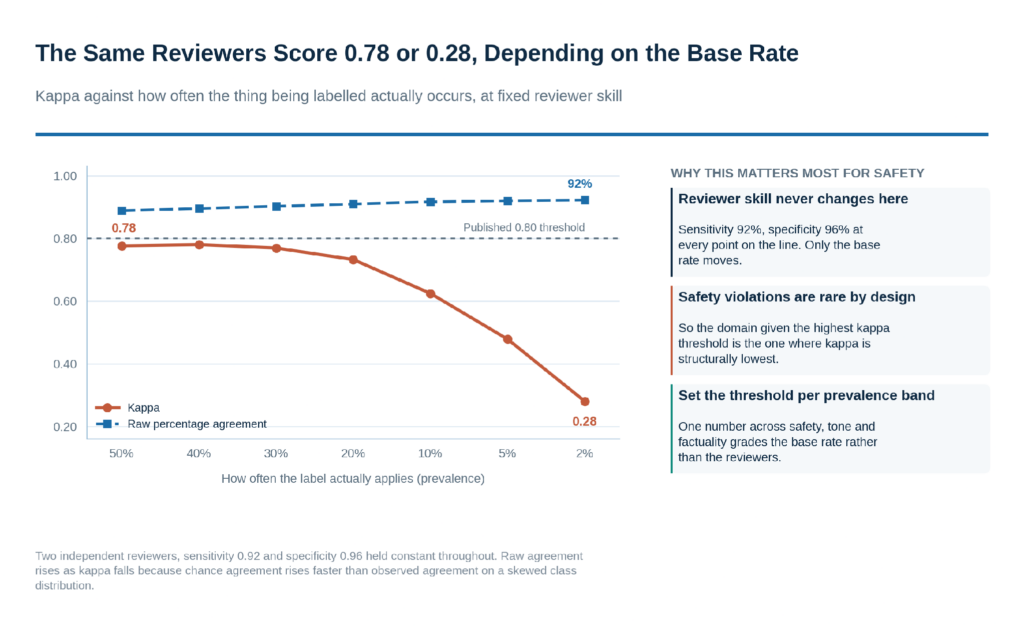
Figure 2. Kappa against base rate, at constant reviewer skill.
Nothing about the reviewers changes along that curve. Sensitivity is 92% and specificity 96% at every point; only how often the label actually applies moves. As the positive class becomes rare, two reviewers who both default to “safe” agree more and more of the time by chance alone, so the chance-correction term grows and kappa collapses even as observed agreement improves.
The practical consequence lands directly on the safety threshold. Safety violations, policy breaches and harmful completions are rare by design — a model that produced them at a 30% rate would not be in production. So the domain that this framework assigns the highest kappa target is precisely the domain where kappa is structurally depressed. A safety pod measured against a flat 0.80 will fail it while doing excellent work, and the predictable response is to relax the threshold, broaden the positive class until the base rate rises, or quietly switch to reporting raw agreement.
Three fixes are cheap. Set thresholds per prevalence band rather than one number across safety, tone and factuality. Report the base rate alongside every coefficient, so a quarter-on-quarter comparison is meaningful. And for rare-label tasks, supplement kappa with a measure that does not collapse under skew — per-class sensitivity and specificity against an adjudicated sample answer the question the coefficient cannot.
Can Calibration Improve Agreement and Damage the Dataset at the Same Time?
Yes, past a point. Calibration removes two kinds of error at different rates: independent error falls, and shared convention error rises as the pod converges on a common reading. Agreement statistics only see the first, so they keep improving after accuracy has started to decline.
Daily huddles, consensus rounds and coaching toward the pod view are the standard calibration apparatus in this market, and early on they are unambiguously valuable. Their whole function is to strip out idiosyncratic variation — one annotator who reads the rubric differently, another who has drifted strict. Removing that raises both agreement and accuracy, and the huddles earn their cost several times over.
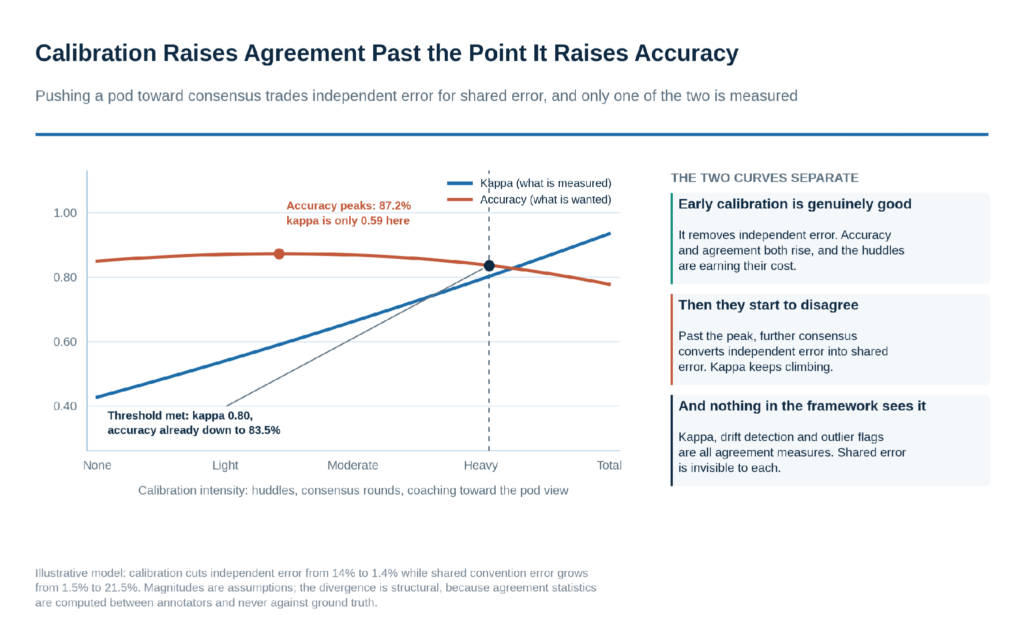
Figure 3. What further consensus buys, and what it costs.
The trouble begins once the idiosyncratic variation is gone and the pressure toward consensus continues. At that stage the only way to raise agreement further is for annotators to converge on a shared reading of the ambiguous cases — and a shared reading is right or wrong as a unit. Independent error is being converted into correlated error, which is worse per unit, because independent errors partially cancel under aggregation and correlated ones do not.
In the modelled pod, accuracy peaks at 87.2% while kappa stands at 0.59. Calibration continues, kappa climbs to 0.80 and the programme records that it has met its quality gate — at 83.5% accuracy, 3.7 points below the peak it passed without noticing. Pushed to full consensus, kappa reaches 0.93 and accuracy falls to 77.7%. The magnitudes depend on assumptions about how fast each error type moves; the divergence does not, because it follows from agreement being measured between annotators and never against truth.
The instrument that closes this gap is a small periodic adjudication against a key written by people who were not in the huddles. It needs to be small — a few hundred items a quarter — because its job is not to grade the pod but to tell the programme which side of the peak it is on. Without it, a rising kappa is genuinely ambiguous evidence, and the programme will read it as good news every time.
In advanced AI training, human disagreement is not just noise — it is often the most valuable signal in the dataset. The differentiator for Philippine providers is not eliminating divergence, but capturing why highly trained linguists interpret edge cases differently, and using those nuances to build safer, more robust alignment guardrails.
— John Maczynski, CEO, Cynergy BPO
That is the right principle, and it sits at odds with every mechanism the surrounding framework describes. Calibration huddles, coaching toward the pod view, workflow halts for deviators, rotation to neutralise cohort effects and a rising kappa as the headline KPI all act to eliminate divergence rather than capture it. Holding the principle requires at least one route by which a disagreement becomes an artefact rather than a correction — in practice, a disagreement log that feeds rubric revisions, and a reported statistic for how many resolved disagreements produced a rubric edit rather than a coaching note.
Who Does Outlier Detection Actually Flag?
Whoever deviates from the pod, which is the accurate annotator whenever the pod shares a bias. In a simulated nine-person pod where eight follow a convention wrong on 12% of items, the ninth is 94.7% accurate against truth and shows only 84.5% agreement with the majority.
Identifying statistical deviation and routing the deviator to coaching is a reasonable default, and it catches the real cases it was built for: the annotator who has drifted strict, the one rating benign responses as toxic, the one who stopped reading carefully. The failure mode appears when the pod itself is the thing that is off.
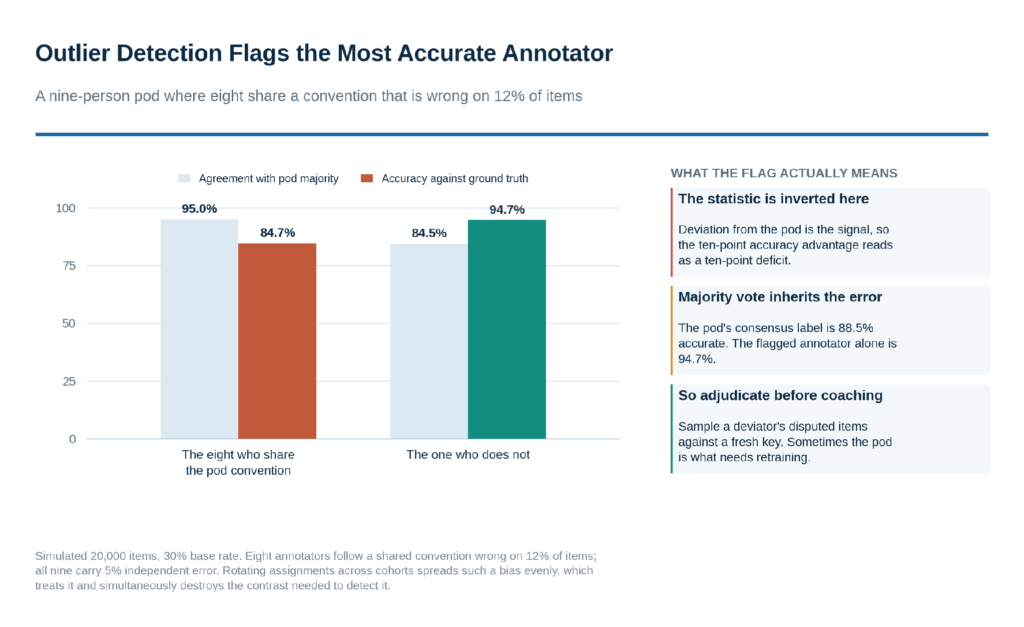
Figure 4. Deviation from the pod, against accuracy against truth.
The numbers invert cleanly. The eight who share the convention agree with the majority 95.0% of the time and are 84.7% accurate. The one who does not agrees 84.5% of the time and is 94.7% accurate. An outlier rule reads the ten-point accuracy advantage as a ten-point deviation and routes the best annotator in the pod to remedial coaching — where the coaching content is, by construction, the convention that is wrong.
Majority vote does not rescue this either. The pod’s consensus label is 88.5% accurate, six points worse than the flagged individual working alone. Redundancy protects against independent error, and this error is not independent.
The fix is procedural rather than statistical, and it is inexpensive. Before a deviation flag becomes a coaching referral, sample a few dozen of the disputed items and adjudicate them against a fresh key by someone outside the pod. Most of the time the flag will be correct and the referral proceeds. Occasionally it will not be, and that case is worth far more than the cost of checking, because it is the only signal a programme ever gets that its convention has drifted.
Does Rotating Assignments Across Cohorts Neutralise Cultural Bias?
It treats the bias and destroys the evidence for it. Rotation spreads a cohort’s systematic skew evenly across the dataset, which dilutes its effect on any single batch. It also removes the contrast needed to detect that the skew exists, because no annotator’s record and no batch shows it concentrated.
Rotating tasks across diverse demographic and academic cohorts is described in this market as neutralising localised cultural blind spots, and as a treatment it works. A bias present in one cohort and spread thinly across a large corpus does less damage than the same bias concentrated in the slice of data that cohort would otherwise own.
Detection is the opposite problem and needs the opposite design. To measure whether a cohort reads a category of prompts differently, the cohort has to remain identifiable and the same items have to be seen by more than one cohort. That is a blocked design: a shared calibration set routed deliberately to every cohort, with cohort recorded, so that a difference in labelling can be attributed. Rotation without that shared block averages the effect into the corpus where nothing can find it.
Running both is straightforward and cheap. Rotate production assignments, which is the right operational default, and route a small standing calibration block to every cohort each cycle. The block is what turns “we neutralise cultural bias” from an assertion into a measurement, and it is the only structure in the framework that can detect a bias the whole pod shares.
What Does “Agreement Improved from 74% to 92%” Actually Mean?
It depends entirely on the base rate, and it is not a kappa. The same 92% raw agreement converts to kappa 0.84 on a balanced task, 0.81 at a 30% base rate, and 0.56 when the label applies to 10% of items — clearing or failing the published 0.80 gate with no change in reviewer skill.
Improvement figures of this size are common in this category and are usually reported as percentages while the governing thresholds are stated as kappa. The two cannot be compared without the base rate, and the conversion is not a detail.
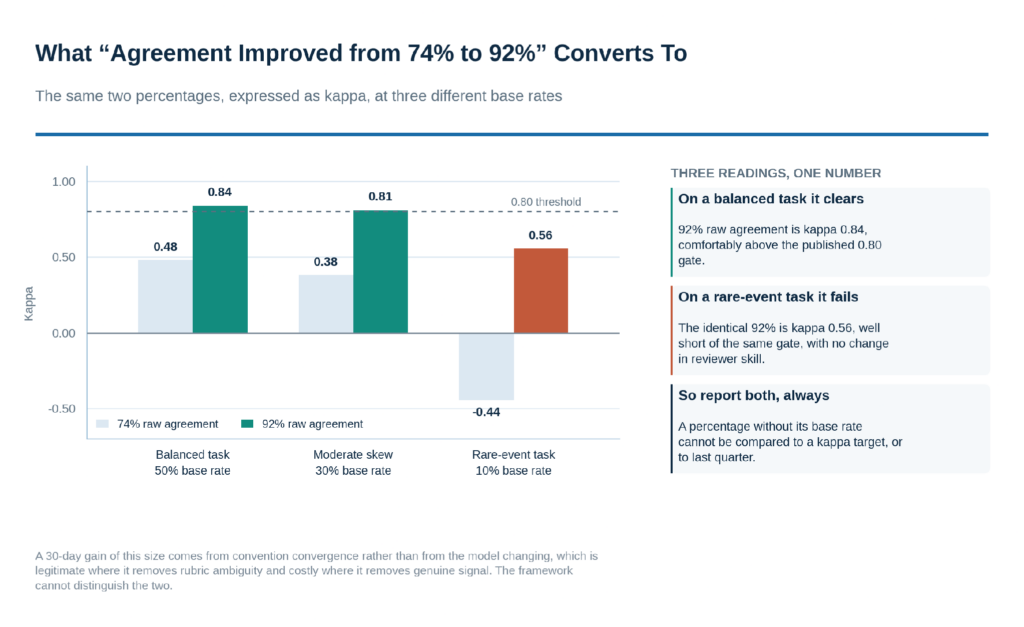
Figure 5. One pair of percentages, three different kappas.
Note the leftmost pair in particular. On a rare-event task, 74% raw agreement converts to a negative kappa — systematically worse than chance — while reading as a respectable-sounding percentage. Any programme quoting agreement in percentage terms should expect that number to be interpreted against a kappa threshold somewhere downstream, and should restate it in the measure the contract actually uses.
There is a second reading worth taking. The model did not change in those 30 days, so the gain came from annotators converging on each other. Some of that convergence is pure value: where the rubric was genuinely ambiguous, resolving it removes disagreement that carried no information. Some of it is the cost described earlier: where the disagreement reflected real interpretive difference, resolving it removes signal. The framework cannot tell a buyer which happened, and the diagnostic is simple — what share of the resolved disagreements produced an edit to the rubric? A high share means ambiguity was removed. A low share means annotators were.
What Should Buyers Ask Providers About Bias Measurement?
Seven questions, each with a specific answer a capable provider can give from live engagements. They concern the base rate behind each coefficient, the existence of any ground-truth instrument, and what happens to a disagreement after it is resolved.
- What is the base rate for each labelled class, reported alongside every coefficient? Without it, a kappa cannot be compared to a threshold, to another task, or to the same task last quarter.
- Is any instrument in the programme measuring accuracy rather than agreement? If every metric is computed between annotators, nothing can detect error the pod shares, and correlated error is the expensive kind.
- Who wrote the golden-set key, and were they in the calibration sessions? A key written by the people who set the convention validates the convention. Independence is what makes it an external check.
- What share of resolved disagreements produced a rubric edit? This separates removing ambiguity from removing dissent, and it is the only routine statistic that distinguishes the two.
- Does a deviation flag get adjudicated before it becomes a coaching referral? A few dozen disputed items checked against a fresh key is the difference between catching a drifting annotator and retraining the best one.
- Is there a shared calibration block routed to every cohort? Rotation treats cohort bias but hides it. A common block seen by all cohorts is what makes the bias measurable.
- Which measure governs the contract, and is it stated as a coefficient or a percentage? Agreement of 92% and kappa of 0.92 are different claims. Contracts should name one measure and one threshold per prevalence band.
How Did One Enterprise Resolve Preference Divergence on a Multilingual Assistant?
An enterprise AI developer facing disagreement above 25% on cultural tone and safety compliance across Southeast Asian languages assessed six Philippine providers on their statistical quality frameworks, and deployed Fleiss’ kappa tracking, golden dataset injection and daily calibration huddles — raising agreement from 74% to 92% within 30 days and cutting fine-tuning iterations by 40%.
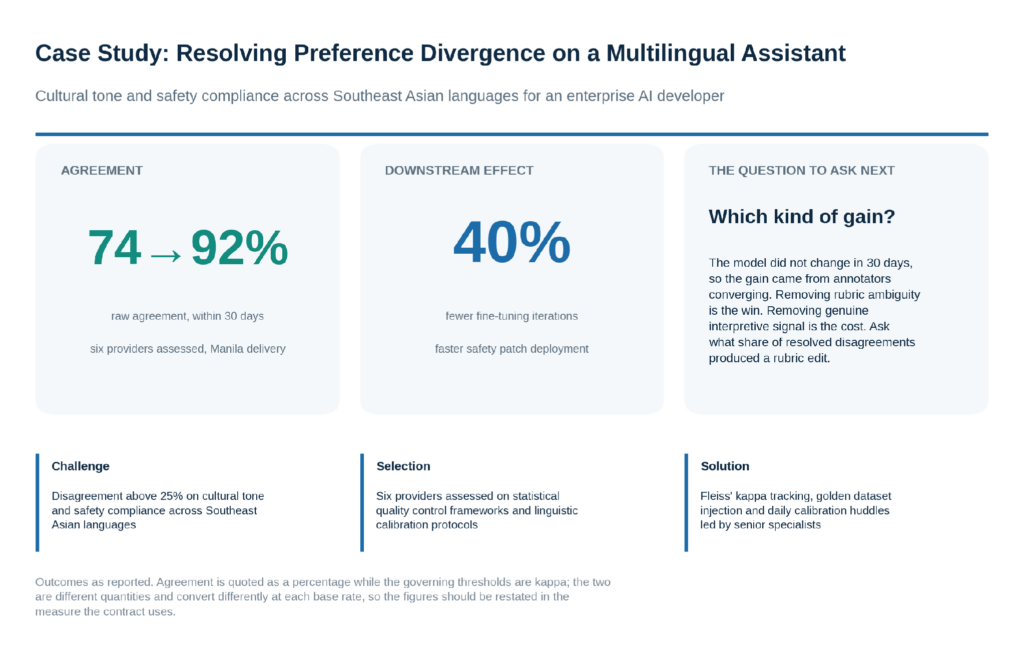
Figure 6. Reported outcomes from a multilingual calibration programme.
Selecting a provider on its statistical quality control framework rather than on throughput or headcount is the strongest decision in this engagement, and it is the one most worth copying. Providers differ far more in how they measure than in what they produce, and the measurement apparatus is visible before signing in a way that output quality is not.
The 40% reduction in fine-tuning iterations is the outcome that matters commercially, and it is more informative than the agreement figure because it is measured on the client’s side against something the client wanted. It is also the figure that would have caught over-calibration had it moved the other way, which makes it the right headline for this kind of programme.
Two things should be restated before the result is carried into a contract. The agreement figures are percentages and the thresholds in the same framework are kappa, so they need converting at the actual base rate for tone and safety labels, which on this workload will be well below 50%. And the 30-day gain reflects annotators converging rather than the model changing, which is the good outcome where it resolved rubric ambiguity and the costly one where it resolved genuine interpretive difference — a distinction the rubric-edit count would settle in an afternoon.
Why Do Organizations Work with Cynergy BPO on Annotation Quality?
Cynergy BPO is an independent, vendor-neutral outsourcing advisory firm headquartered in Manila, representing a vetted network of more than 100 Philippine providers. It maps requirements against performance data to produce a shortlist within days and manages competitive negotiation on the buyer’s behalf.
Who Is Cynergy BPO?
Cynergy BPO is an independent outsourcing advisory and consultancy firm headquartered in Manila, founded by industry veterans with more than 65 years of combined operational experience governing major global accounts. It specialises in connecting mid-market and enterprise organisations with vetted Philippine BPO providers across voice, back-office and AI data operations.
How Does Cynergy BPO Differ from Traditional Outsourcing Brokers?
Traditional brokers are transactional and are compensated by the providers they place, which shapes which provider is recommended. Cynergy BPO applies an advisory-led methodology, mapping exact technical, security and commercial requirements against performance data. On annotation quality, where the decisive question is whether a provider measures anything other than agreement, that independence determines what gets asked.
How Does Cynergy BPO’s Network of 100+ Vetted Philippine BPO Providers Benefit Organizations?
The network establishes which providers report base rates alongside their coefficients, which run an independent ground-truth instrument rather than only agreement statistics, and which can show what happens to a disagreement after it is resolved — differences invisible in any capability deck and decisive for dataset quality.
How Does Cynergy BPO’s Advisory-Led Vendor Matching Process Work?
Requirements are mapped against operational, security and commercial criteria, a tailored shortlist of vetted providers is delivered within a few working days, and the firm then manages competitive proposal and negotiation processes on the buyer’s behalf. The governing measure, the threshold per prevalence band and the adjudication route are settled during that process rather than after the first quality dispute.
Why Do Organizations Use Cynergy BPO?
Because the quality framework a provider presents will be statistically literate and still incomplete in the same specific way. Knowing which question closes the gap — what in this programme measures accuracy rather than agreement — is worth more than any benchmark in the deck.
Frequently Asked Questions
What is the difference between Cohen’s kappa, Fleiss’ kappa and Krippendorff’s alpha?
Cohen’s kappa compares exactly two raters using each rater’s own marginals. Fleiss’ kappa handles a fixed number of raters who need not be the same people across items. Krippendorff’s alpha handles any number of raters, any scale type and missing data, which makes it the right choice for ordinal and text-span work.
What minimum agreement should enterprise AI work require?
It depends on the base rate, which is why a single number across domains does not work. At fixed reviewer skill, kappa runs 0.78 on a balanced task and 0.28 when the label applies to 2% of items. Set a threshold per prevalence band and report the base rate alongside every coefficient.
Is a Krippendorff’s alpha of 0.78 acceptable?
Only for tentative conclusions. Krippendorff’s published cutoffs are 0.800 for firm conclusions and 0.667 for preliminary ones, so 0.78 sits in the tentative band — and it is usually applied to the most subjective content in the pipeline, where the consequences of being wrong are highest.
Can calibration sessions reduce data quality?
Past a point, yes. Early calibration removes independent error and raises both agreement and accuracy. Continued pressure toward consensus converts independent error into shared error, which agreement statistics cannot see. A small periodic adjudication against an independently written key is what tells a programme which side of the peak it is on.
How should an annotator flagged as an outlier be handled?
Adjudicate before coaching. Sample a few dozen of the disputed items against a fresh key written outside the pod. Where the pod shares a bias, the deviation statistic inverts and the most accurate annotator is the one flagged — and the coaching content would be the convention that is wrong.
How often should golden datasets be injected?
Five to ten percent is sound at batch level. The care is needed on individual decisions: at 7% insertion on 300 items a week, one annotator is judged on about 21 items, which is far too small a sample to carry an automatic consequence. Aggregate over a rolling multi-week window.
Does rotating assignments across cohorts remove cultural bias?
It dilutes the effect and removes the evidence. Rotation spreads a cohort’s skew evenly, which helps, but it also destroys the contrast needed to detect that the skew exists. Pair rotation with a shared calibration block routed to every cohort, with cohort recorded, so differences can be attributed.
What background do annotators handling bias analysis need?
Degrees in linguistics, philosophy, psychology or computer science are the common profile and a reasonable one. The more useful design question is mixture: a pod drawn from one background shares its blind spots, and a shared blind spot is precisely the error that every agreement statistic in the framework will score as a success.
Share This
Unlock cost-efficient growth with expert BPO guidance!
Partner with Cynergy BPO to connect with top outsourcing providers.
Streamline operations, cut costs, and scale your business with confidence.
Book a Free Call
Ralf Ellspermann - CSO
Author
Ralf Ellspermann is the Chief Strategy Officer (CSO) of Cynergy BPO and a globally recognized authority in business process and contact center outsourcing. With more than 25 years of experience advising enterprises and SMEs, he provides strategic guidance on vendor selection, CX optimization, and scalable outsourcing strategies across global markets. His expertise spans fintech, ecommerce and retail, healthcare, insurance, travel and hospitality, and technology (AI & SaaS) outsourcing.
A frequent speaker at leading industry conferences, Ralf is also a published contributor to The Times of India and CustomerThink, where he shares insights on outsourcing strategy, customer experience, and digital transformation.