



By: Ralf Ellspermann
25-Year, Multi-Awarded BPO Veteran
Published: 12 October 2026

Reviewed By: John Maczynski
Former EVP, World's Largest Contact Center
Updated: 12 October 2026
Use per-class thresholds, not one number. A single 3D IoU bar allows 36 cm of error on a car and 5 cm on a pedestrian, and the public benchmarks the field trusts accept 0.70 for cars and 0.50 for pedestrians. For small objects, centre distance in metres is the more honest metric.
Key Takeaways
- A 3D IoU threshold is a tolerance that scales with object length. At 0.85 it permits 81 cm of displacement on a truck, 36 cm on a car and 4.9 cm on a pedestrian. The tightest demand falls on the smallest objects, which return the fewest points.
- The benchmarks the field actually uses are far below 0.85. KITTI sets its 3D IoU threshold at 0.70 for cars and 0.50 for pedestrians and cyclists. nuScenes abandoned IoU altogether in favour of centre distance, because small footprints with a small translation error give zero IoU.
- Thresholds carried over from 2D land much tighter in 3D. Errors compound across three axes rather than two. A score of 0.85 corresponds to a 4.1% error budget in 2D and only a 2.7% budget in 3D.
- Fully loaded specialised technical data engineering support ranges from $10 to $16 per hour. Roughly $1,730 to $2,770 per seat per month at 173 hours, with onboarding and toolchain integration typically spanning six to eight weeks.
- Point density is a property of the sensor, not of the annotator. It cannot be a provider quality metric. The usable version is a minimum-returns rule: below a stated point count, flag the object for camera-assisted review rather than labelling it blind.
- Advisory-led matching tests whether the quality bar is physically reachable. Deriving the threshold from the perception stack’s own error budget, and checking it against the sensor’s sampling interval, are decisions that belong before the shortlist.
What Does a 3D IoU Threshold of 85% Actually Demand?
It demands that the box centre be placed within a fixed fraction of the object’s own length. At 0.85 that is 81 cm on a truck, 36 cm on a car, 14 cm on a cyclist and 4.9 cm on a pedestrian. The same number is several different standards.
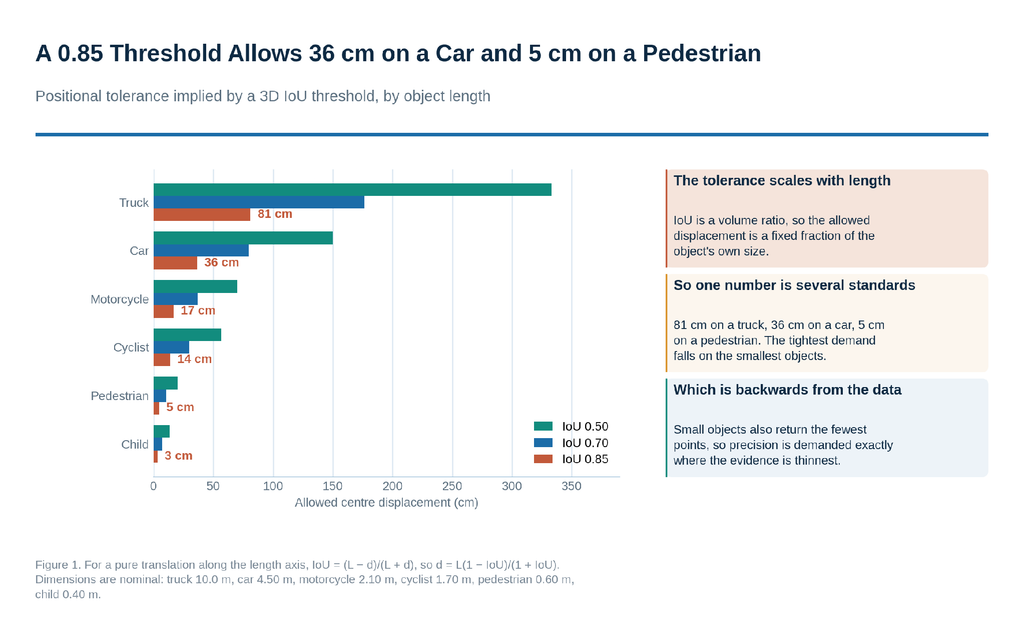
Figure 1. Positional tolerance implied by a 3D IoU threshold.
For a pure translation along an object’s length axis, the intersection over union works out to (L − d) divided by (L + d), where L is the length and d the displacement. Rearranged, the allowed displacement is L multiplied by (1 − IoU) over (1 + IoU). Because IoU is a ratio of volumes, the tolerance is proportional to the object’s own size, and a single threshold therefore produces a sliding scale across the ontology.
The direction of that scale is the problem. The loosest tolerance lands on trucks and buses, which are large, densely sampled and easy to fit. The tightest lands on pedestrians and children, which are small, sparsely sampled and the reason the perception system exists. A specification written as one number quietly asks for the most precision where the evidence is thinnest.
What Thresholds Does the Field Itself Use?
Substantially lower ones. KITTI’s 3D detection benchmark sets the IoU threshold at 0.70 for the Car class and 0.50 for Pedestrian and Cyclist. Waymo’s Open Dataset uses the same split. nuScenes matches on centre distance instead, at 0.5, 1, 2 and 4 metres.
This matters because those thresholds define what counts as a successful detection by an algorithm, after the algorithm has been trained on human labels. The draft’s proposal asks human annotators to clear a bar well above the one the field applies to finished perception systems, and to clear it uniformly across classes where the benchmarks deliberately differentiate.
The nuScenes authors are explicit about why they left IoU behind. Their stated reason is that objects with small footprints, like pedestrians and bikes, if detected with a small translation error, give zero IoU. Centre distance decouples the match criterion from object size and orientation, which is exactly the coupling that makes a single IoU threshold behave so differently across an ontology. When the people who build the reference datasets for this industry conclude that 3D IoU cannot fairly rank small objects, a procurement document should be slow to adopt it as a universal acceptance test.
Why Are 3D Thresholds Stricter Than They Look?
Because errors compound across three axes instead of two. A uniform relative error on each dimension reduces a volume ratio faster than an area ratio. A score of 0.85 corresponds to roughly a 4.1% error budget for a 2D box and only about 2.7% for a 3D cuboid.

Figure 2. The same relative error, scored in two dimensions and three.
Numbers that feel familiar from 2D bounding-box practice are therefore materially harsher when applied to cuboids. At an 8% relative error a 2D box still scores 0.73 while the equivalent cuboid scores 0.64. Anyone setting a 3D threshold by analogy with a 2D one they have used before will land somewhere considerably stricter than they intended, without any deliberate decision having been made.
Where the Threshold Should Come From
The defensible route is to work backwards from the perception stack’s own error budget. A planner has a tolerance for how wrong an object’s position may be at a given range before the behaviour it produces becomes unsafe or uncomfortable. That tolerance, expressed in metres, converts directly into a per-class IoU or centre-distance figure. A threshold derived that way can be defended in a design review; a threshold chosen because it reads as exacting cannot, and will be renegotiated the first time a batch fails.
Is the Required Precision Physically Available in the Data?
Often not. A 64-beam LiDAR at 0.40 degrees of vertical spacing has a 28 cm gap between beams at 40 metres. The 0.85 threshold on a pedestrian demands the centre be placed to 4.9 cm. Beyond about seven metres the beam spacing alone exceeds the entire tolerance.
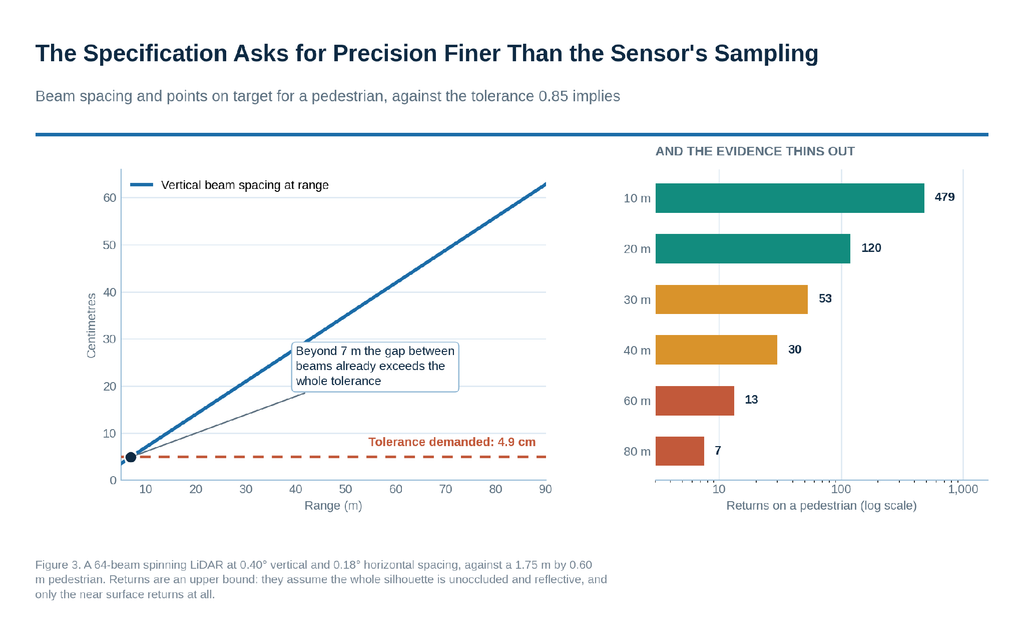
Figure 3. Sensor sampling against the demanded precision.
A pedestrian at 40 metres returns on the order of 30 points under generous assumptions, and that figure assumes the whole silhouette is unoccluded and reflective. At 60 metres it is around 13, and at 80 metres around 7. Asking an annotator to place a box centre to five centimetres from a dozen returns spread across a 42 cm beam gap is not a demand for care. It is a demand that they guess consistently, and consistency in guessing is what a threshold like this actually measures.
What LiDAR Never Sees
There is a deeper issue that IoU quietly folds in. A LiDAR return comes from the near surface of an object. The far face of every cuboid, and therefore the object’s depth, is not observed at all: it is inferred from what the annotator knows a car or a pedestrian is shaped like. A 3D IoU score against a reference box is consequently a blend of two different things. Part of it measures how carefully the annotator fitted the points that exist, and part measures how closely their class prior matched whoever produced the reference. Only the first is a property of the work.
The practical response is to separate them. Score the observed faces against the returns, and treat the inferred extent as a convention set by the handbook rather than as an accuracy question. A project that specifies, for instance, that vehicle depth is taken from a class-standard dimension table unless more than a stated fraction of the far surface is visible will get more consistent labels than one that leaves every annotator to infer independently and then grades them on the result.
Does a Single Orientation Tolerance Work Across Classes?
No, and it fails in the opposite direction to the positional tolerance. A two-degree yaw error costs a truck real IoU because of its elongated footprint, and costs a pedestrian almost nothing because a square footprint is close to rotation-invariant. Pitch and roll are usually not in the schema at all.
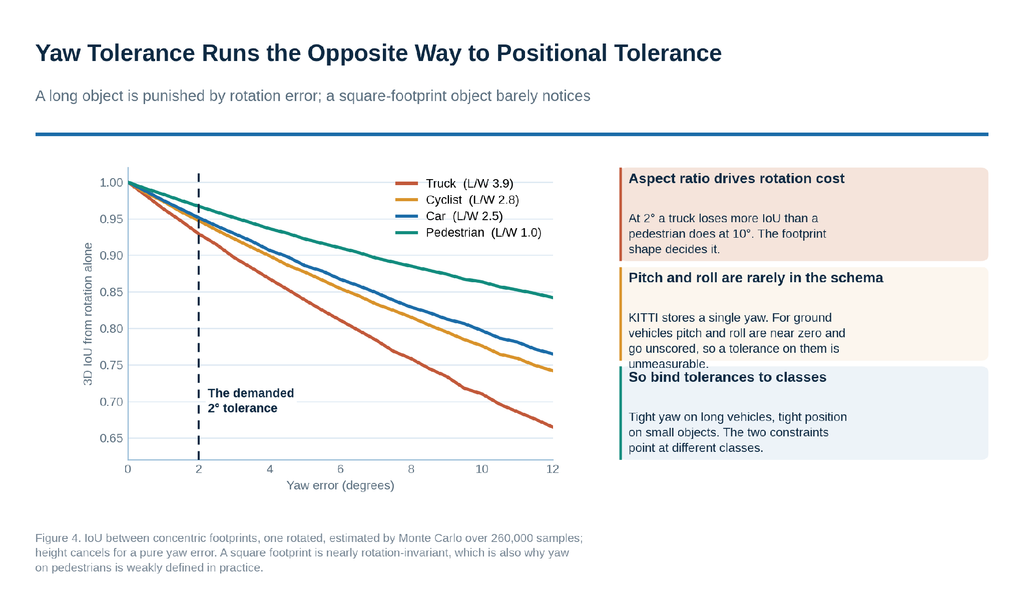
Figure 4. Yaw error against footprint aspect ratio.
The interaction is worth noticing because it cuts against the first finding. Positional tolerance is hardest on small objects; rotational tolerance is hardest on long ones. A specification with one number for each will be simultaneously too loose and too tight in different parts of the same ontology, and the aggregate score will hide both. Binding tolerances to class groups resolves it: tight yaw on long vehicles, tight position on small objects, and a frank acknowledgement that pedestrian yaw is weakly defined and disagreed upon by careful annotators.
Pitch and Roll
Specifying a two-degree tolerance on yaw, pitch and roll suggests the clause was written without reference to the label format in use. KITTI stores a single rotation about the vertical axis. Datasets that store a full orientation still see pitch and roll close to zero for ground vehicles on level surfaces, and the public benchmarks do not score them. If the annotation tool does not expose those axes, the clause cannot be measured; if it does, the values are dominated by ego-motion compensation and sensor calibration rather than by annotator care. Either way it is not a useful control.
What Should the Metric Specification Say Instead?
Per-class thresholds derived from the planner’s error budget, centre distance rather than IoU for small classes, yaw only with tolerances tied to aspect ratio, a minimum-returns rule in place of density compliance, an explicit denominator for defect rates, and geometric accuracy separated from attribute correctness.
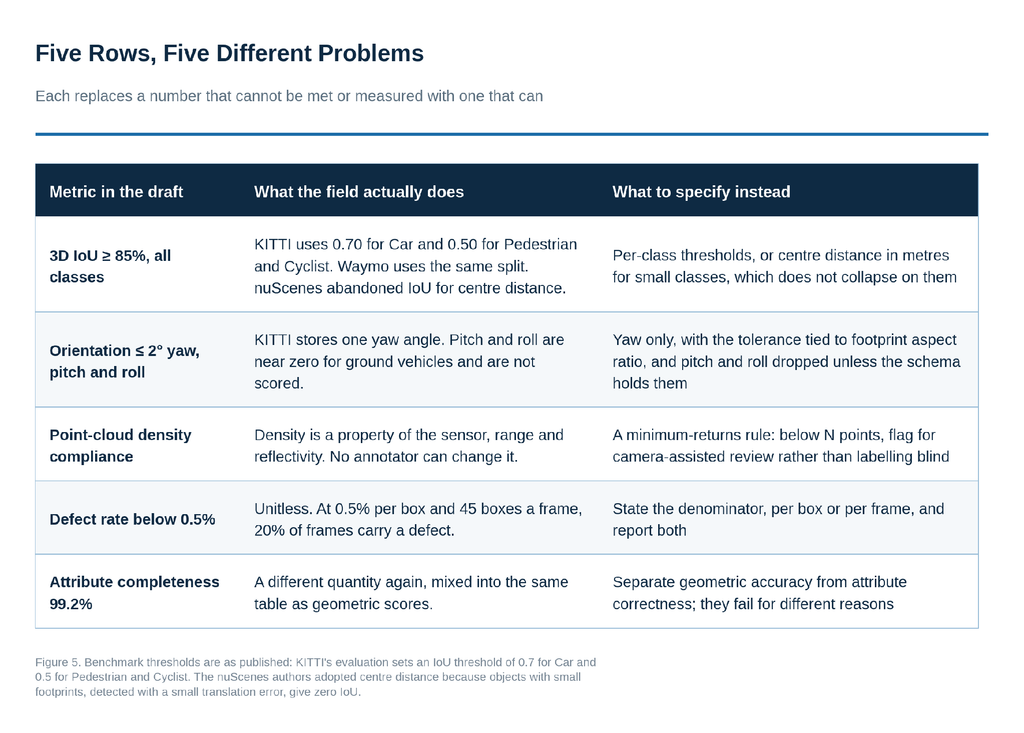
Figure 5. Five metrics, replaced with measurable equivalents.
Point Density Measures the Sensor
Point-cloud density is a function of sensor model, mounting height, range, incidence angle and surface reflectivity. An annotator cannot change any of them, so it cannot serve as a measure of provider quality. It confuses a property of the data with a property of the work. The version that is about the work is a minimum-returns rule: below a stated number of points, do not label the object from the cloud alone, but flag it for camera-assisted review or mark it as unlabelled by rule. That is measurable, it is auditable, and it directly prevents the failure mode of confidently drawn boxes around three returns.
Defect Rates Need a Denominator
A defect rate below 0.5% is a very different promise depending on its unit. At 0.5% per box, a frame containing 45 boxes has a roughly 20% chance of carrying at least one defect, and a frame with 80 boxes a 33% chance. At 0.5% per frame the same words describe a far stricter standard. Contracts should state which, and reporting both is more useful than either alone, because per-box rates reveal annotator consistency while per-frame rates reveal what the downstream consumer actually experiences.
What Operational Risks and Tradeoffs Must Enterprises Navigate?
The main risks are a threshold the sensor cannot support, one number applied across classes with opposite sensitivities, metrics that measure the data rather than the work, and quality figures reported without the class breakdown that would locate where the problem is.
Temporal Consistency Is a Separate Measurement
Frame-by-frame IoU says nothing about whether an object keeps its identity and dimensions across a sequence. A track that is individually well-fitted in every frame but jitters in size or swaps identity at an occlusion will train a model to expect instability. Useful controls here are specific: dimension variance within a track, count of identity switches per thousand frames, and a check that interpolated frames were reviewed rather than accepted. None of these appear in a per-frame accuracy figure, and all of them matter more for velocity and trajectory estimation than a marginal IoU improvement does.
Sensor Fusion and Calibration Ambiguity
Where camera imagery is overlaid on sparse returns to help annotators, calibration and synchronisation errors present as annotation errors. If the extrinsic calibration is a few centimetres out, or the timestamps are misaligned by tens of milliseconds at speed, the projected image will not agree with the cloud and the annotator will resolve the disagreement by judgement. The handbook should say which sensor wins when they disagree, and the pilot should measure the residual disagreement before the team is graded on it.
Security and Data Protection
Leading Philippine facilities enforce data loss prevention protocols, isolated secure clean rooms, biometric access control and non-disclosure agreements, commonly alongside ISO 27001 certification. Buyers should confirm the scope of a certificate rather than its existence, since scope determines whether it covers the delivery floor. Where scenes contain identifiable people or number plates, the buyer’s own obligations are engaged: transfers of European personal data require standard contractual clauses or another Article 46 mechanism, because the Philippines does not hold a European Commission adequacy decision.
What Does 3D Annotation Cost and How Long Does It Take to Stand Up?
Fully loaded specialised technical data engineering support ranges from $10 to $16 per hour, roughly $1,730 to $2,770 per seat per month at 173 hours. Provisioning and technical training covering point-cloud geometry, toolchain integration and pilot testing typically spans six to eight weeks.
A dedicated full-time equivalent model gives a steadier monthly figure than per-item rates, but predictability is a choice about which quantity is fixed rather than a property of the model. An FTE contract fixes cost and lets throughput vary; a per-item contract fixes unit price and lets the monthly total vary. Which is preferable depends on measured throughput on the client’s own sequences, and that number should come out of the pilot rather than the negotiation. Cuboid throughput varies more with scene density and occlusion than with annotator skill, so a rate agreed against generic assumptions will be wrong in one direction or the other.
Why Do Global Enterprises Partner with Cynergy BPO for Technical Outsourcing?
Because the decisive question is whether the quality bar is physically reachable in the client’s own data, and it has to be settled before providers are compared. Cynergy BPO derives thresholds from the perception stack’s error budget, checks them against the sensor’s sampling, and matches against more than 100 vetted Philippine providers.
Who Is Cynergy BPO?
Cynergy BPO is a specialised, vendor-neutral advisory and consultancy that partners with more than 100 carefully vetted BPO and back-office service providers across the Philippines. Its focus is the structured evaluation and selection of outsourcing partners for organisations whose requirements are technical rather than purely transactional, including LiDAR and point-cloud annotation, sensor-fusion data operations and robotics engineering support.
LiDAR and 3D annotation require absolute geometric precision; approximation is never an option. When enterprises partner with Cynergy BPO, we match them with Philippine technical providers whose spatial data expertise and quality assurance rigor meet the exacting standards of global robotics leaders.
John Maczynski, CEO, Cynergy BPO
How Does Cynergy BPO Differ from Traditional Outsourcing Brokers?
A broker’s shortlist reflects which providers it can place work with. An advisory shortlist should reflect which providers can meet a specified requirement, and should say plainly when the requirement exceeds what the data supports. That distinction has unusual force here: a buyer who asks for 85% 3D IoU across all classes will be told yes by every provider approached, and will learn nothing that separates them. A buyer who asks what centre-distance error each provider achieves on pedestrians beyond forty metres will learn a great deal.
How Does Cynergy BPO’s Network of 100+ Vetted Philippine BPO Providers Benefit Organizations?
Providers differ in ways a capability list does not reveal: depth in point-cloud tooling rather than familiarity with it, genuine sensor-fusion overlay workflows rather than side-by-side viewing, whether their label schema matches the client’s without a lossy conversion, and how annotators are trained on the specific geometry of the client’s sensor rig. A network of that size lets these be treated as hard constraints, and supports comparison on measures that predict delivery, including measured cuboid throughput on the client’s own sequences and agreement between two of the provider’s own experienced annotators.
How Does Cynergy BPO’s Advisory-Led Vendor Matching Process Work?
The sequence is deliberate. The first four steps decide whether the quality bar is reachable at all; only the last turns it into a shortlist.
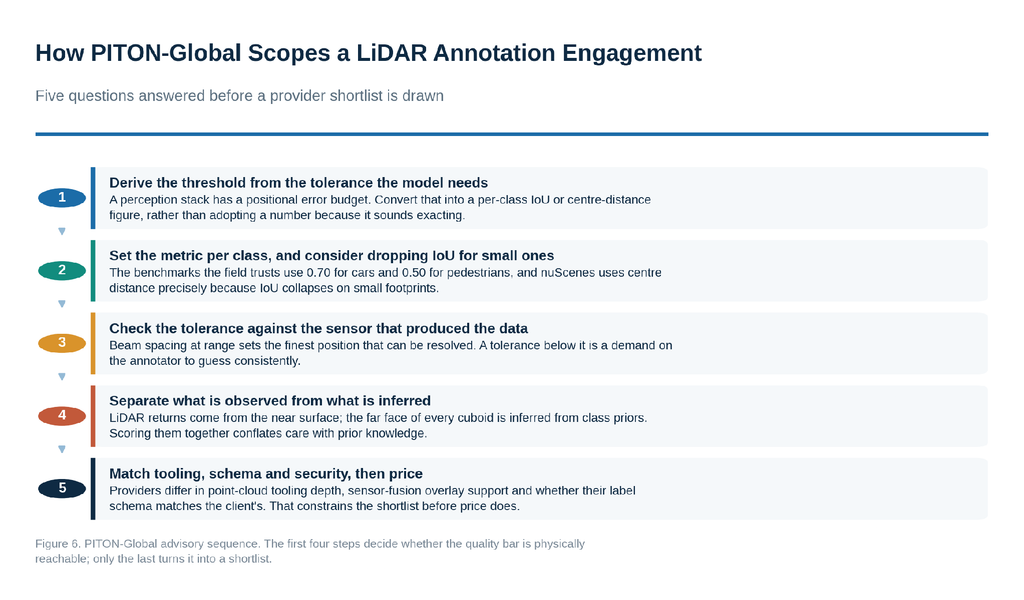
Figure 6. The advisory sequence, from error budget to shortlist.
Why Do Organizations Use Cynergy BPO?
Because the expensive errors in this category are geometric and are made during specification. Deriving the threshold from the planner’s tolerance, differentiating it by class, checking it against beam spacing at the ranges that matter, and separating observed geometry from inferred geometry are all decisions that shape the statement of work, and none of them are in a provider’s interest to raise unprompted. Objective market intelligence and structured matchmaking then reduce transition risk against a requirement that is sound to begin with.
Frequently Asked Questions
What 3D IoU threshold should enterprises demand for autonomous vehicle LiDAR data?
Set it per class and derive it from the planner’s positional error budget rather than adopting a single figure. For reference, KITTI uses 0.70 for cars and 0.50 for pedestrians and cyclists, and Waymo uses the same split. For small classes, centre distance in metres is a more stable criterion, which is why nuScenes uses it.
Why does one threshold behave so differently across object classes?
Because IoU is a ratio of volumes, so the tolerance it implies is proportional to object size. A 0.85 bar allows 81 cm of displacement on a truck and 4.9 cm on a pedestrian. Rotation runs the other way: a two-degree yaw error costs an elongated truck real IoU and costs a square-footprint pedestrian almost nothing.
How do Philippine teams handle sparse point clouds at long range?
Through multi-sensor fusion overlays that let analysts cross-reference camera imagery with sparse returns. The control that matters is a minimum-returns rule: below a stated point count, the object is flagged for camera-assisted review or marked unlabelled by rule rather than boxed from a handful of points.
Should we specify pitch and roll tolerances?
Usually not. KITTI stores a single yaw angle, and for ground vehicles on level surfaces pitch and roll are near zero and go unscored by the public benchmarks. If the annotation tool does not expose those axes the clause is unmeasurable, and if it does, the values reflect calibration and ego-motion compensation rather than annotator care.
How should temporal consistency be measured?
Separately from per-frame accuracy. Useful measures are dimension variance within a track, identity switches per thousand frames, and confirmation that interpolated frames were reviewed rather than accepted. A sequence can score well on frame-by-frame IoU and still teach a model that object sizes fluctuate.
How do Philippine BPO providers secure proprietary LiDAR datasets?
Through data loss prevention protocols, isolated secure clean rooms, biometric access control and non-disclosure agreements, commonly alongside ISO 27001 certification. Verify the scope of any certificate rather than its existence, and confirm your own transfer basis where scenes contain identifiable people.
What is the typical onboarding timeline for a 3D annotation squad?
Six to eight weeks covering point-cloud geometry, toolchain integration and pilot testing. The pilot should produce two numbers before full ramp: measured cuboid throughput on the client’s own sequences, and agreement between two experienced annotators on the same frames, which sets the achievable ceiling.
What should we settle before approaching providers?
The positional tolerance the perception stack actually needs, per class and at the ranges that matter, and whether the sensor’s sampling supports it. Those two answers determine every threshold in the contract and should be settled before price is discussed.
Share This
Unlock cost-efficient growth with expert BPO guidance!
Partner with Cynergy BPO to connect with top outsourcing providers.
Streamline operations, cut costs, and scale your business with confidence.
Book a Free Call
Ralf Ellspermann - CSO
Author
Ralf Ellspermann is the Chief Strategy Officer (CSO) of Cynergy BPO and a globally recognized authority in business process and contact center outsourcing. With more than 25 years of experience advising enterprises and SMEs, he provides strategic guidance on vendor selection, CX optimization, and scalable outsourcing strategies across global markets. His expertise spans fintech, ecommerce and retail, healthcare, insurance, travel and hospitality, and technology (AI & SaaS) outsourcing.
A frequent speaker at leading industry conferences, Ralf is also a published contributor to The Times of India and CustomerThink, where he shares insights on outsourcing strategy, customer experience, and digital transformation.