



By: Ralf Ellspermann
25-Year, Multi-Awarded BPO Veteran
Published: 28 September 2026

Reviewed By: John Maczynski
Former EVP, World's Largest Contact Center
Updated: 28 September 2026
Talent scarcity in the domain tiers, infrastructure and security overhead, and night-shift attrition. The one most often mispriced is attrition, because its cost is the replacement pipeline rather than the rate: at identical attrition, losing a domain specialist costs roughly nine times what losing a general tagger costs.
Key Takeaways
- Attrition is a rate multiplied by a pipeline, and only the rate gets quoted. A one-week replacement pipeline in the general tier against 9.5 weeks in the domain tier means the same 30% attrition leaves 0.58% of general seats unproductive and 5.48% of domain seats — a ninefold difference at identical churn.
- So a blended pod attrition figure hides the number that matters. Contract and measure attrition per tier. At 45% churn in the domain tier, 109 people must be employed to keep 100 productive, and the buyer pays for the contracted headcount.
- Retention effort is allocated by shift; the cost is concentrated by tier. The worst combination — night-shift domain experts — loses 16.6 times the capacity of day-shift general taggers. Moving the longest pipeline off the hardest shift beats any wellness programme.
- A leased line cannot fix latency, because the constraint is distance. Manila to Virginia floors near 182 milliseconds on physics alone, and observed round trips of 200 to 234 milliseconds sit close to that. Leased lines buy bandwidth, jitter and contention, not a shorter path.
- And latency bites hardest on the simplest work, not the hardest. A chatty tool making 15 round trips per item loses 5.5% of a 60-second complex item and 45.8% of a 7.2-second tagging item. The fix is architectural: an in-region endpoint or a client that prefetches.
- One setup timeline cannot cover four skill tiers. Four to eight weeks fits general tagging, where hiring takes 72 hours. Domain expertise needs seven to twelve weeks for the first cohort alone, and a mixed pod is ready when its slowest tier is ready.
Which Skill Tiers Create Which Bottlenecks?
Four, and each has a different binding constraint. General tagging is limited by floor space, bilingual QA by calibration time rather than hiring, domain expertise by wage competition and a nine-week pipeline, and supervision by the fact that it cannot be recruited externally at any speed.
The tier table in general use is accurate and useful, and the column it omits is the one that converts every other figure into a cost. Recruitment velocity and training duration are usually reported separately; added together they give the replacement pipeline, which is the multiplier on every departure and the single most decisive number in a workforce plan.
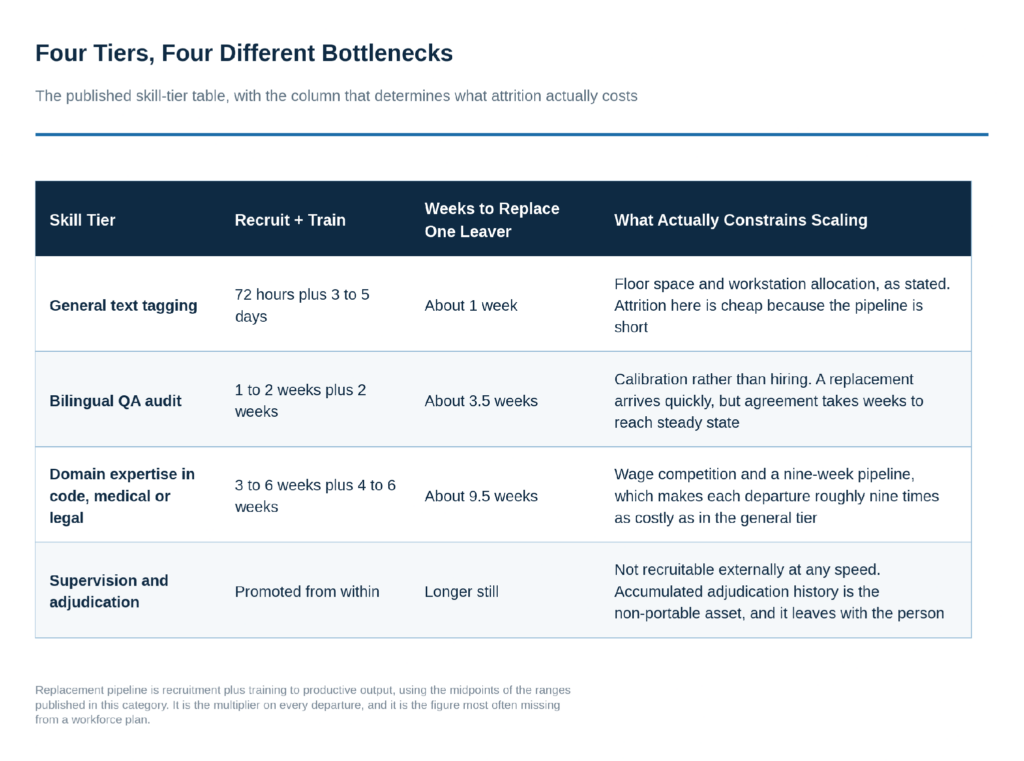
Figure 1. Four tiers, four different bottlenecks.
The fourth row is worth adding explicitly because it is where scaling programmes most often stall. Supervisors and adjudicators are promoted from within, which means they cannot be hired against a deadline, and what they carry is the accumulated record of how ambiguous cases were resolved on this specific workload. That history is not written down in any transferable form, so a supervisor’s departure removes capability that no replacement can restore quickly. On a scaling programme, supervision depth should be built ahead of the agent headcount rather than alongside it.
The bilingual QA row deserves a similar correction. Recruitment there is only moderately hard, so the tier reads as manageable — but the binding constraint is calibration, and a replacement who arrives in two weeks still takes several more to reach the pod’s steady-state agreement. Counting that person as productive on their start date overstates capacity for a month.
What Does Attrition Actually Cost on a Scaling Programme?
The rate multiplied by the replacement pipeline, which differs ninefold across tiers. At 30% annual attrition, a one-week pipeline leaves 0.58% of seats permanently unproductive and a 9.5-week pipeline leaves 5.48%. The rate alone says almost nothing about the cost.
Attrition is discussed in this market as a single percentage attached to a pod or a facility. That framing is the reason retention spending is usually misallocated, because two tiers with identical churn impose completely different costs on the programme.
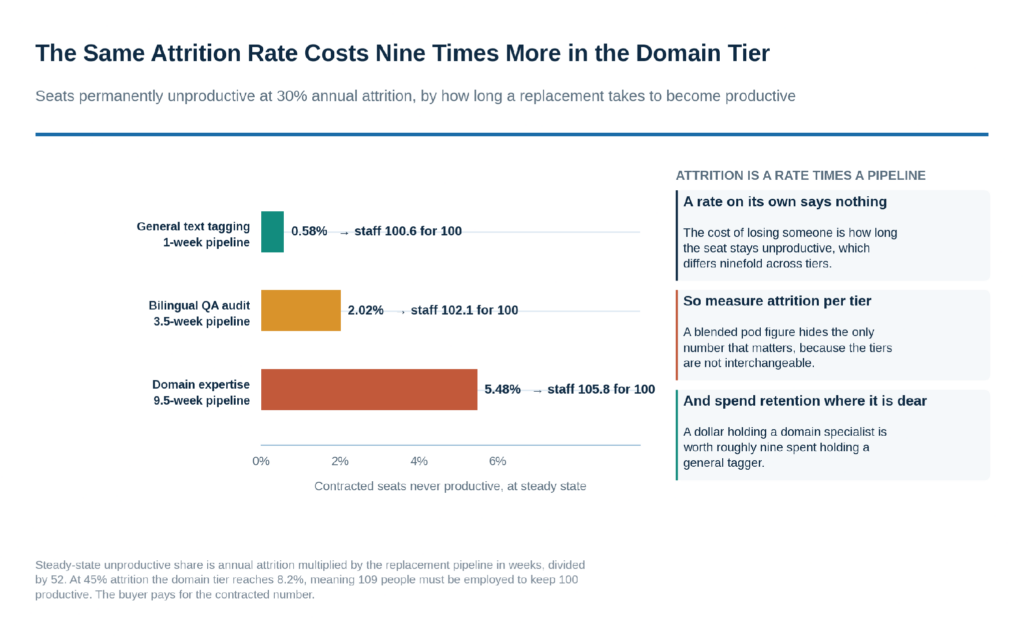
Figure 2. What the same attrition rate costs in each tier.
The arithmetic is simple and worth running on any workforce plan. At steady state, the share of contracted seats that are never productive equals the annual attrition rate multiplied by the replacement pipeline in weeks, divided by 52. In the general tier that is a rounding error. In the domain tier at 45% attrition it reaches 8.2%, which means 109 people must be on the payroll to keep 100 productive — and a buyer contracting for 100 seats is paying for a number that does not describe delivered capacity.
Three consequences follow directly. Attrition should be measured and reported per tier, not per pod, because a blended figure is dominated by the tier with the most heads and the least consequence. Seat counts in contracts should distinguish contracted from productive, with the provider carrying the gap. And retention investment should be weighted by pipeline length, which means a dollar spent holding a domain specialist is worth roughly nine spent holding a general tagger — close to the opposite of how wellness and engagement budgets are normally distributed.
There is a second cost that does not appear in the arithmetic at all. In the specialist tiers, a departure removes accumulated judgement about how this particular workload’s edge cases are resolved, and that is what drives the guideline drift the case study in this category describes. The replacement pipeline measures when a seat becomes productive again. It does not measure when the pod gets back the consistency it had.
Where Should Retention Effort Actually Go?
Toward the longest replacement pipelines first, and only then toward the hardest shifts. Night-shift domain experts lose 16.6 times the annual capacity of day-shift general taggers, but shift differentials and wellness programmes are allocated along the shift axis alone, which is the smaller of the two.
The mitigations described in this market — structured shift rotation, ergonomic workstations, wellness programmes, competitive shift differentials — are all sound and all organised by shift. That is a reasonable instinct, because night work is genuinely harder. It is also only one dimension of a two-dimensional problem.
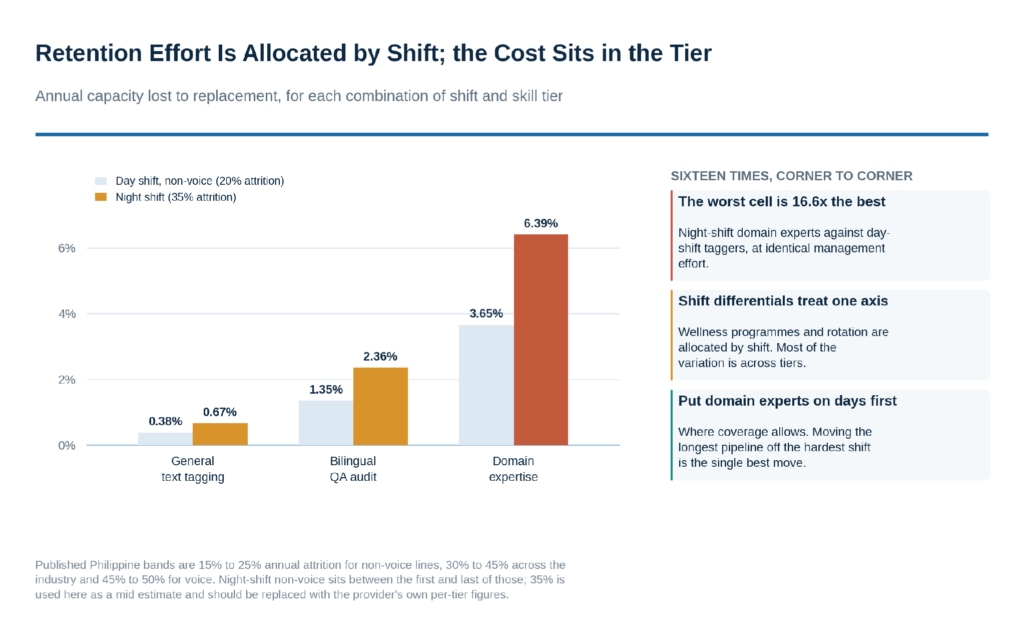
Figure 3. Capacity lost to replacement, by shift and by tier.
Reading across the chart, moving from day to night roughly doubles the loss within any tier. Reading down it, moving from general tagging to domain expertise multiplies the loss by nine. The tier axis is the larger effect, and it is the one that receives no dedicated spend in the standard mitigation list.
The most valuable single action follows from the shape of the grid rather than from any programme: where coverage requirements allow it, put the domain tier on day shift and the general tier on nights. General tagging is the tier where a departure costs a week, so it is the tier that can absorb a harder shift. Domain expertise is where a departure costs nine weeks, so it is the tier that should sit where churn is lowest. This costs nothing beyond the scheduling work, and it addresses both axes at once.
Where coverage cannot be arranged that way — because the client’s engineering team is in a Western time zone and the specialists need to overlap with it — the differential paid to a night-shift domain specialist should reflect a nine-week pipeline rather than a shift premium set uniformly across the floor.
Scaling artificial intelligence training in the Philippines is an exercise in operational engineering, not just headcount accumulation. Enterprises that treat data annotation as a commodity process will inevitably hit walls of data drift, security friction, and workforce burnout.
— John Maczynski, CEO, Cynergy BPO
The distinction between engineering and headcount has a concrete test on this workload. A headcount plan tracks seats contracted. An engineering plan tracks productive seats by tier, replacement pipelines, calibration time for arrivals, and the supervision depth that has to exist before the agent count grows. The three walls named in the quotation are all consequences of the same omission: a plan that counts people rather than capability will be short of capability at exactly the moment it looks fully staffed.
Is Network Latency a Procurement Problem or an Architecture Problem?
An architecture problem. A dedicated leased line buys bandwidth, jitter and freedom from contention, all of which matter. It cannot shorten the path, and Manila to Virginia floors near 182 milliseconds on the speed of light in fibre alone — close to the 200 to 234 milliseconds typically observed.
Dedicated enterprise-grade leased lines are recommended across this market as the answer to network bottlenecks, and for bulk dataset transfer that advice is correct: moving terabytes is bandwidth-bound, and contention on a shared link is exactly the problem a leased line solves. For interactive annotation work it addresses the wrong variable.
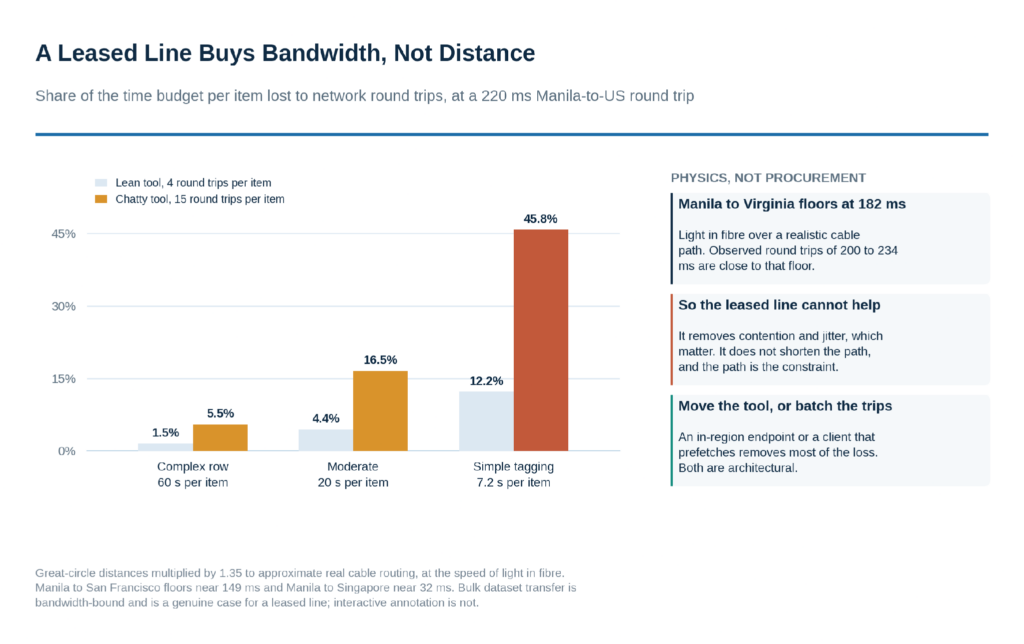
Figure 4. Where round-trip latency actually costs throughput.
The physical floor is worth stating plainly because it ends the procurement conversation. Manila to San Francisco is about 11,200 kilometres as the crow flies and perhaps 15,100 by realistic cable routing; light in fibre covers that round trip in roughly 149 milliseconds. Manila to Ashburn floors near 182. No commercial arrangement reduces those numbers, and observed latencies of 200 to 234 milliseconds indicate a network already operating close to its physical limit.
What varies, and what a buyer controls, is how many times the tool crosses that distance per item. A lean client that fetches a batch and submits a batch might make four round trips per item, costing 0.88 seconds. A chatty one that validates every field against the server might make fifteen, costing 3.3 seconds. Against a 60-second complex item those are 1.5% and 5.5% — negligible. Against a 7.2-second tagging item they are 12.2% and 45.8%.
That inverts the usual intuition. Latency is close to irrelevant for the complex, high-value work that feels most demanding, and it is dominant on the simple high-volume work that feels least demanding. So the diagnostic is not the link — it is the tool and the task speed. Where the loss is material, the fixes are architectural: host the annotation endpoint in-region, prefetch work in batches, validate client-side, and reserve the leased line for the bulk transfers where it genuinely earns its cost.
How Long Does It Take to Stand Up a Team?
Between one and 9.5 weeks of recruitment and training for a first cohort, depending entirely on tier. The commonly quoted 4 to 8 weeks fits general tagging comfortably and misses domain expertise, which needs seven to twelve weeks before infrastructure and security clearance are counted.
Setup timelines are quoted as a single range in this market while the tier table in the same source shows a ninefold spread in hiring difficulty. Both cannot be right, and the mismatch is worth surfacing before it becomes a missed milestone.
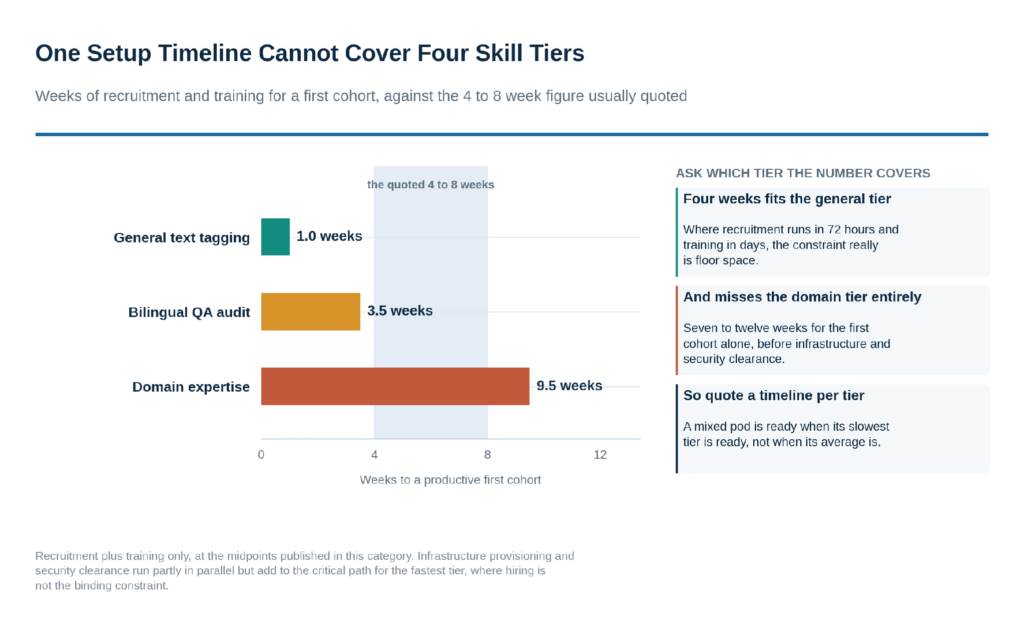
Figure 5. First-cohort timelines against the quoted range.
For the general tier, four weeks is achievable and hiring is not the constraint — floor space, workstations, provisioning and security clearance are, which is exactly what the tier table says. For the domain tier, recruitment alone runs three to six weeks and training another four to six, so the first productive cohort arrives at week seven at the earliest and week twelve at the latest, with everything else running in parallel underneath.
The practical rule is that a mixed pod is ready when its slowest tier is ready, not when its weighted average is. A 100-seat team that is 70% general taggers and 30% domain specialists will show 70 seats productive at week four and reach full strength somewhere past week ten. Plans built on a blended timeline schedule the first milestone against capability that does not yet exist, which is a common route to the kind of missed deadline described in the case studies in this category.
What Should Buyers Verify Before Scaling?
Seven things, all answerable from a provider’s existing operations and none of which appear in a capability deck. They concern per-tier figures rather than pod averages, and productive capacity rather than contracted headcount.
- Attrition reported per tier, not blended across the pod. A single pod figure is dominated by the tier with the most heads and the shortest pipeline, which is the tier where churn costs least.
- The replacement pipeline the provider actually achieves per tier. Recruitment plus training to productive output. It is the multiplier on every departure and it is rarely volunteered.
- Contracted seats against productive seats, with the gap carried by the provider. At 45% domain-tier attrition the gap is around 8%, and a contract that does not name it puts that cost on the buyer.
- Which tiers sit on which shifts, and why. Putting the longest replacement pipeline on the hardest shift is the most expensive scheduling decision available, and it is usually made by accident.
- How many round trips the annotation tool makes per item. Against a 220-millisecond link this is the whole latency question. The answer decides whether an in-region endpoint is worth building.
- Setup timelines quoted per tier, with the slowest tier named. A blended figure schedules the first milestone against capability that will not exist for another six weeks.
- Supervision depth built ahead of agent headcount. Supervisors are promoted internally and carry the adjudication history. They cannot be hired against a deadline, so they have to be grown before the deadline exists.
How Did One Retail Enterprise Overcome Scaling Bottlenecks in Cebu?
A multinational retail technology corporation scaling a multilingual product categorization dataset from 50,000 to 2 million records, facing a 24% error rate and high night-shift turnover across a fragmented vendor base, consolidated onto a dedicated 120-seat pod at a 1:8 supervisor ratio with custom micro-training — reaching a 1.4% error rate within 45 days.
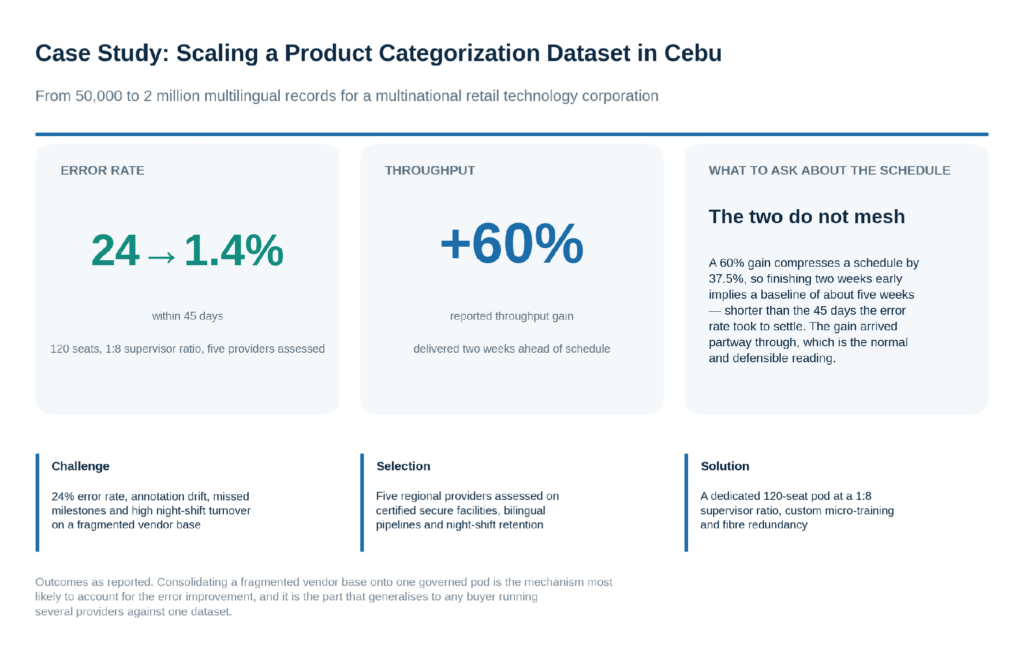
Figure 6. Reported outcomes from a 120-seat Cebu programme.
Consolidation is the mechanism most likely to account for the error improvement, and it is the part that generalises. Several providers working one dataset against one guideline will produce several interpretations of that guideline, and the disagreement between them appears in the aggregate as error without any individual annotator being wrong. Moving to a single governed pod removes that source before any coaching happens. Any buyer running more than one provider against a single corpus should expect a measurable improvement from consolidation alone.
The 1:8 supervisor ratio is heavier than the 1:10 typical of high-change programmes, which is consistent with a workload carrying both night-shift churn and domain ambiguity. It is also a cost: fifteen supervisors on 120 seats is a material uplift on delivery price, and a throughput figure quoted without it is a gross number. Buyers comparing two providers on speed should establish what ratio each assumes before treating the comparison as meaningful.
One timing note for anyone modelling from these figures. A 60% throughput gain compresses a schedule by 37.5%, so finishing two weeks early implies a baseline of roughly five weeks — shorter than the 45 days the error rate took to settle. The natural reading is that the throughput gain arrived partway through rather than applying from day one, which is both normal and worth stating, because a plan that assumes the gain from the start will be a fortnight optimistic.
Why Do Organizations Work with Cynergy BPO on Scaling Programmes?
Cynergy BPO is an independent, vendor-neutral outsourcing advisory firm headquartered in Manila, representing a vetted network of more than 100 Philippine providers. It maps requirements against performance data to produce a shortlist within days and manages competitive negotiation on the buyer’s behalf.
Who Is Cynergy BPO?
Cynergy BPO is an independent outsourcing advisory and consultancy firm headquartered in Manila, founded by industry veterans with more than 65 years of combined operational experience governing major global accounts. It specialises in connecting mid-market and enterprise organisations with vetted Philippine BPO providers across voice, back-office and AI data operations.
How Does Cynergy BPO Differ from Traditional Outsourcing Brokers?
Traditional brokers are transactional and are compensated by the providers they place, which shapes which provider is recommended. Cynergy BPO applies an advisory-led methodology, mapping exact technical, security and commercial requirements against performance data. On scaling programmes, where the decisive figures are per-tier pipelines rather than pod averages, that independence determines which numbers get requested.
How Does Cynergy BPO’s Network of 100+ Vetted Philippine BPO Providers Benefit Organizations?
The network establishes which providers hold standing pipelines in the domain tiers rather than recruiting against each engagement, what per-tier attrition each actually runs, and which have supervision bench depth already grown — the three differences that decide whether a scaling plan holds, and the three least likely to appear in a proposal.
How Does Cynergy BPO’s Advisory-Led Vendor Matching Process Work?
Requirements are mapped against operational, security and commercial criteria, a tailored shortlist of vetted providers is delivered within a few working days, and the firm then manages competitive proposal and negotiation processes on the buyer’s behalf. Per-tier attrition, replacement pipelines, the productive-seat gap and tier-to-shift allocation are normalised across bids during that process.
Why Do Organizations Use Cynergy BPO?
Because the figures that determine whether a scaling programme succeeds — replacement pipeline by tier, productive against contracted seats, supervision bench depth — are not the figures a provider leads with. Knowing to ask for them before signature is most of the value, and it is difficult to do from a single procurement.
Frequently Asked Questions
What is the biggest bottleneck when scaling LLM training in the Philippines?
Domain-tier talent, because its replacement pipeline runs around 9.5 weeks against about one week for general tagging. That ratio, rather than the attrition rate, is what determines the cost of churn and the realism of any scaling timeline.
How should attrition be measured on an annotation programme?
Per tier, and multiplied by the replacement pipeline. A blended pod figure is dominated by the tier where churn is cheapest. At 30% attrition the domain tier loses nine times the capacity the general tier loses, at the same rate.
How many people are needed to deliver 100 productive seats?
More than 100, and the gap depends on tier. In the general tier it is negligible. In the domain tier at 45% annual attrition, around 109 people must be employed to keep 100 productive, and the contract should say who carries that difference.
Does a dedicated leased line solve latency to the Philippines?
No. Manila to the US east coast floors near 182 milliseconds on the speed of light in fibre, and observed round trips of 200 to 234 milliseconds are already close to that. A leased line removes contention and jitter and helps bulk transfer, but the path length is fixed.
When does network latency actually hurt annotation throughput?
On fast, simple work with a chatty tool. Fifteen round trips per item at 220 milliseconds costs 3.3 seconds, which is 5.5% of a 60-second complex item and 45.8% of a 7.2-second tagging item. Reduce round trips or host the endpoint in-region.
How long does it take to set up a 100-seat annotation team?
Four to eight weeks for general tagging, where hiring runs in 72 hours and the constraint is provisioning. Seven to twelve weeks for a domain-expert cohort. A mixed pod is ready when its slowest tier is ready, so quote and schedule per tier.
How should night-shift attrition be managed?
By allocating tiers to shifts before allocating budget to programmes. Put the shortest replacement pipelines on the hardest shifts where coverage allows, since the tier axis drives roughly nine times the variation that the shift axis does. Where that is not possible, price the differential against the pipeline rather than uniformly.
What security standards apply to annotation facilities?
ISO 27001 and SOC 2 Type II are certifications a provider holds, and the scope statement matters more than the certificate — confirm the delivery floor, the tooling and any escalation channels sit inside the certified boundary. Data protection statutes are laws rather than certifications, and the obligations fall on the buyer as controller.
Share This
Unlock cost-efficient growth with expert BPO guidance!
Partner with Cynergy BPO to connect with top outsourcing providers.
Streamline operations, cut costs, and scale your business with confidence.
Book a Free Call
Ralf Ellspermann - CSO
Author
Ralf Ellspermann is the Chief Strategy Officer (CSO) of Cynergy BPO and a globally recognized authority in business process and contact center outsourcing. With more than 25 years of experience advising enterprises and SMEs, he provides strategic guidance on vendor selection, CX optimization, and scalable outsourcing strategies across global markets. His expertise spans fintech, ecommerce and retail, healthcare, insurance, travel and hospitality, and technology (AI & SaaS) outsourcing.
A frequent speaker at leading industry conferences, Ralf is also a published contributor to The Times of India and CustomerThink, where he shares insights on outsourcing strategy, customer experience, and digital transformation.